An Analysis of Health Equity in the San Joaquin Valley Region
A Report from the San Joaquin Valley Public Health Consortium
February, 2022

Acknowledgements
The San Joaquin Valley Public Health Consortium (SJVPHC) acknowledges all indigenous peoples who first inhabited the land now referred to as the San Joaquin Valley, including the Chumash, Kawaiisu, Kitanemuk, Miwok, Monache, Ohlone, Paiute-Shoshone, Salinan, Serrano, Tataviam, Tübatulabal, and Yokut tribes. We honor these tribes and thank them for allowing us to live and work in their homelands.
We would like to also thank and acknowledge SJVPHC’s Regional Health Equity Analysis Workgroup members for their collaboration and support in the creation of this report:
- Melanie Ruvalcaba, Fresno County Department of Public Health
- Sara Bosse, Madera County Department of Public Health
- Kristina Allen, Mariposa County Health and Human Services Agency
- Monica White, San Joaquin County Department of Public Health
- Chelsey Donohoo, Stanislaus County Health Services Agency
- Bree Godoy, Tulare County Health and Human Services Agency
- Laura Salcido, Tulare County Health and Human Services Agency
- Nesreen Gusbi, Tulare County Health and Human Services Agency
- Katherine Schaff, Berkeley Media Studies Group
- Chinyere Amobi, Berkeley Media Studies Group
- Emanuel Alcala, Central Valley Health Policy Institute
- Dr. Tania Pacheco-Werner, Central Valley Health Policy Institute
- Lesley Sept, Stanford Center for Population Health Sciences
- Dr. David Rehkopf, Stanford Center for Population Health Sciences
- Tracy Lam-Hine, Stanford Center for Population Health Sciences
We extend additional gratitude to The California Endowment, whose financial support made the report possible.
The San Joaquin Valley Public Health Consortium
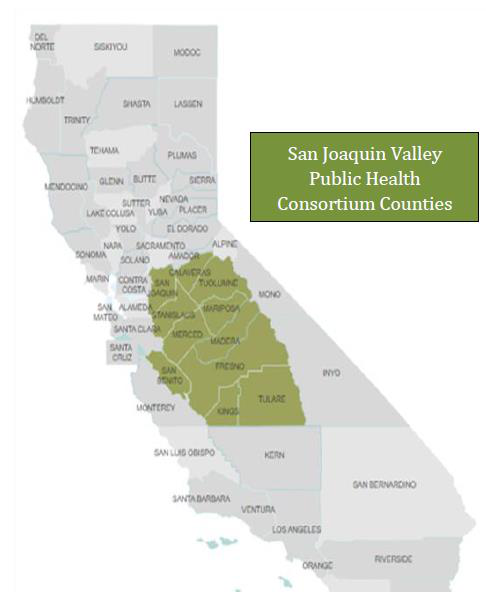
The San Joaquin Valley Public Health Consortium is made up of public health department leaders in eleven counties located in California’s San Joaquin Valley. Its Leadership Committee consists of Public Health Directors, Assistant/Deputy Directors, and Health Officers from member counties; subcommittees and workgroups support the work of the Consortium. California State University Fresno’s Central California Center for Health and Human Services serves as the fiscal and administrative backbone. SJVPHC was created in 1999 to support the work of local public health jurisdictions to improve the health of communities in the region.
The San Joaquin Valley Landscape
California’s San Joaquin Valley (the Valley) is the southern part of what’s known as the Central Valley and is primarily rural, although it contains multiple urban centers. This report includes information on twelve of the region’s counties: Calaveras, Fresno, Kern, Kings, Madera, Mariposa, Merced, San Benito, San Joaquin, Stanislaus, Tulare, and Tuolumne.
Challenges
The Valley is known for its extremely hot, dry summers and densely foggy winters. The area has long experienced a severe drought and is experiencing the effects of the climate crisis in multiple ways, including record wildfires and low groundwater levels due to increased water extraction for agricultural production (the region’s primary industry). One of the most polluted regions in both the state and the nation, the Valley experiences high levels of toxic contamination in its air, water, and land.
Other challenges for residents of the San Joaquin Valley include low educational attainment, widespread poverty, a swiftly growing and exceptionally diverse population, significant health needs, and limited public health and healthcare resources. Large portions of the landscape are rural, creating significant challenges related to access to resources that support health, prosperity, social connectedness, and longevity.
Assets and Strengths
Some of the Valley’s most prominent challenges are also its greatest assets, however. The diversity, commitment, ingenuity, and resiliency of the region’s people have carried them through decades of hardship and adversity and make the Valley a unique and valuable place to live for many. As such, the region is one of the fastest growing in the state, with a 2019 total population of over 4 million and a projected population of almost 6.5 million by 2060.
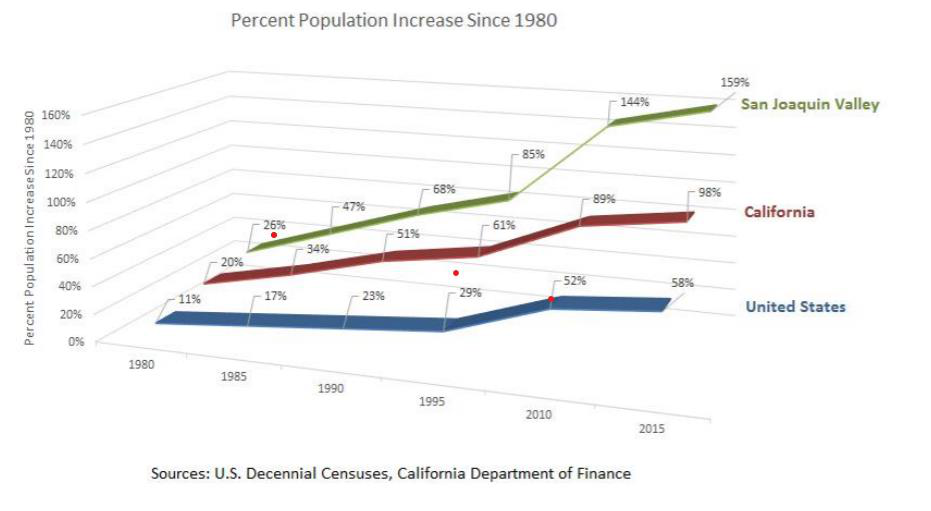
The region’s population has increased by more than 159% since 1980, and 24 US states have smaller population sizes.
Racial and Ethnic Diversity
The 2019 racial composition of the twelve counties that are the focus of this report are provided in the following chart.
The Valley is home to many sizable and eclectic racial/ethnic communities, including Assyrians, Dutch, Sikhs, Croats, Portuguese, Armenians, Basques, East Indians (natives of Punjab, Gujarat and Southern India), Pakistanis, Syrians, Azorean Portuguese, and Filipinos. In addition, communities of immigrants from Indochina- Hmong, Thai, Laotian, Cambodian, and Vietnamese- have settled in the cities of Stockton, Modesto, Merced, and Fresno following the War in Vietnam.
The eight counties that make-up what is traditionally referred to as the San Joaquin Valley (Fresno, Kern, Kings, Madera, Merced, San Joaquin, Stanislaus, and Tulare) have a combined foreign-born population of 900,000. Over two-thirds of this population are Latino immigrants, many from the Mexican regions of Oaxaca, Sinaloa, and Guerrero and speak languages other than Spanish.
The Valley has a rich history filled with noteworthy achievements by minority groups which continues to influence the culture today. Just a few of these include Allensworth (the only town in California founded, funded, and governed by African Americans) in Tulare County, the first permanent Sikh house of worship established in the United States (in San Joaquin County), and the United Farm Worker movement led by César Chávez and Dolores Huerta that originated in Kern County during the 1960s.
Economic Contribution
The San Joaquin Valley’s economic contribution to both the nation and the state is significant; its largest contributions come through its agricultural and energy production. According to California’s Department of Food and Agriculture, eight of the state’s top ten agriculture producing counties in 2019 were Valley counties. In the same year, the twelve Valley counties highlighted in this report (just 21% of California’s 58 counties) produced 60% of the state’s income from agriculture. The Valley produced $37 billion in agricultural products in 2019- more than twice the rest of the state and more than the state of Iowa, the next highest producer in the country. If it were its own state, the region would be the top agricultural producing state in the nation.
In addition, several of the largest oil fields in the country exist in the region; the San Joaquin basin in Kern County is the most prolific oil-producing area in California.
About this Report
Purpose and Design
While the report is not a statistical analysis, it is intended to bring light to the greatest needs in the region and to identify areas of priority for future investment, collaboration, planning, and action. Solutions to inequities will need to be grounded in addressing upstream causes to create sustained, effective change. Data measuring social determinants of health have therefore been included to highlight areas for potential upstream intervention and to provide context for health outcomes across the region.
The goals for this report are to:
- Provide regional information to local health departments to support the important work they do in their jurisdictions and provide a tool for increased collaboration across counties
- Inform policymakers, communities and community-based organizations about similarities and disparities within the region and across regions in California (both related to health outcomes and to their social determinants), and to support their efforts to improve health and quality of life in the Valley
- Inform the goals and activities of SJVPHC, to include the development of a legislative/policy platform and policy priorities, workforce training, and subcommittee and workgroup efforts
Methods
Collaboration and Support
A workgroup was created to provide feedback on the selection of indicators and data sources for the analysis. Staff from public health departments (including public health directors, program managers, project directors, epidemiologists, and health education specialists) in San Joaquin, Stanislaus, Mariposa, Tulare, Fresno, and Madera counties provided insight, expertise, and feedback to inform the analysis. In addition, experts from the Central Valley Health Policy Institute (CVHPI), the Stanford Center for Population Health Sciences (PHS), and Berkeley Media Studies Group (BMSG) generously provided additional expertise relevant to their work. Workgroup meetings were held to determine goals for report utilization, identify intended audiences, and determine priority indicators and data sources. Additional meetings were held with BMSG, CVHPI and PHS for technical assistance.
Data Collection
Regional data from the Healthy Places Index (HPI) was collected and analyzed but was ultimately not included due to the availability of more recent data from other sources. Identification of areas of high need for the region were identified through this analysis of HPI data, however, and these informed the final selection of indicators included in the analysis.
Data for each county in California was then downloaded from the following websites:
- PLACES: Local Data for Better Health
- County Health Rankings and Roadmaps
- KidsData
- County Health Status Profiles
- CalEnviroscreen 4.0
Regional Groupings
Filters were applied in Excel and SPSS to datasets downloaded from the above sources, based on four regional/sub-regional categories:
| Grouping | Description |
|---|---|
| Central San Joaquin Valley (Central SJV) | The eight valley-floor counties traditionally described as the San Joaquin Valley (Fresno, Kern, Kings, Madera, Merced, Stanislaus, San Joaquin, and Tulare) |
| San Joaquin Valley-Adjacent (SJV-Adjacent) | The four SJVPHC counties that lie adjacent to the Central San Joaquin Valley counties listed above (Calaveras, Mariposa, San Benito, and Tuolumne) |
| San Joaquin Valley (SJV) | All twelve San Joaquin Valley counties (eight Central SJV and four SJV-Adjacent) |
| CA | All 58 counties in the state, including the twelve in the SJV regional grouping |
| Non-San Joaquin Valley (Non-SJV) | The 46 counties in the state located outside the San Joaquin Valley |
The following rationale was applied to the creation of these regional and sub-regional groups:
- Eleven of the twelve counties included in the SJV grouping are members of the San Joaquin Valley Public Health Consortium. Kern County, while not a member of the consortium, is typically included in geographic descriptions of the Valley, and was included in the analysis to provide the most accurate picture of the region.
- The Non-SJV grouping was created to provide an accurate picture of the uniqueness of the Valley’s needs and strengths related to population health, in relation to the rest of the state. Including numbers for the twelve counties in the SJV grouping when calculating means for the state results in a limited picture of the higher need in the region for many of the selected indicators, as the numbers for counties in the Valley often pull the state number in their direction (either higher or lower, depending on the indicator).
- Similarly, upon reviewing county-level data for the twelve-county SJV region, sub-regional disparities between the eight counties located in the central valley floor and the four counties that lie adjacent to them (the three foothill/mountain counties to the east and San Benito County to the west) were identified. Thus, the Central-SJV and SJV-Adjacent grouping were added to provide greater accuracy and elevated understanding.
Data Analysis
Data for these regional groupings was then analyzed according to the data value type provided in each dataset (prevalence, rate per 1,000, etc.), most frequently by calculating means. While numerators for each county were provided in some datasets for some indicators, data collected for many indicators included only state and county percentages (for example, % of adults who smoke). Where raw numbers were provided, regional and state percentages were calculated by adding numerators and denominators for all counties and dividing the total numerator by the total denominator to identify regional/state percentage. For indicators that included data in rates, indexes, or percentages, means were calculated across counties using the data as provided. Age-adjusted rates were used where provided in the original datasets.
Limitations
Several limitations to this analysis have been identified, as follows:
- While an attempt was made to use the most recent available data, the included data was collected prior to the COVID-19 pandemic. It is likely that conditions in the state and its regions (including the San Joaquin Valley) have been hugely affected by the pandemic, and this should be considered when reading the report.
- Aggregated, county-level data, rather than data on individual persons, was used in the analysis. Because of this, differences in county population sizes are not accounted for. All counties hold the same weight in the analysis, regardless of size.
- The Non-SJV grouping includes counties with several diverse geographical sub-regions (from far northern rural to urban Los Angeles), whereas the SJV group and its sub-groups (Central SJV and SJV-Adjacent) are more homogeneous geographically. In addition, this grouping includes a much larger number of counties (46 as opposed to just twelve, for example).
- No statistical analysis was conducted, and it can therefore not be confirmed whether identified differences are not the result of chance.
- Logical assumptions must be made about possible connections between social determinants of health and health outcomes based on the results of this analysis, as we did not include an investigation of how indicators included in the report relate to each other. In addition, information about historical and existing systems and root causes for disparities was not included (for example, probable causes for lower high school completion rates in the Valley). A great deal of evidence has established a connection between social conditions (such as structural racism and poverty) and health outcomes, however, and it is now widely accepted to address social conditions as determinants of health.
- Data on race/ethnicity was available for only a handful of indicators and the data for different racial and ethnic groups that was collected did not include all the racial and ethnic groups that exist in the state and the Valley. In addition, many of the numbers for several racial/ethnic groups were missing for smaller counties. Racial and ethnic breakdowns and comparisons will be provided in a separate, upcoming report.
- Data for several indicators was missing or unreliable for smaller counties, both in the Valley and in other counties in the state (see Appendix A).
- The report does not include information at the level of individual counties, which would provide additional context and clarity about the findings. A follow-up analysis of data for individual counties in the Valley is planned for the near future.
- Several indicators (all of those from the CDC PLACES dataset) are based on self-report data from the Behavioral Risk Factor Surveillance Survey (BRFSS), and therefore dependent on respondents’ knowledge about their health conditions and willingness to disclose them. It is possible that some respondents had undiagnosed health conditions they were not aware of when interviewed.
Results
The tables below show the results of the analysis for each of the five regional groupings by indicator, as well as the numerical value for the difference between the group(s) faring the best (green cells) and worst (red cells) for each indicator. In the Determinants of Health table, indicator titles including an * are those for which higher values correspond to better health outcomes (for example, opportunities to exercise). In both tables, red cells indicate the regional group faring the worst on the indicator, while green cells indicate those faring the best. In addition, cells with ** indicate missing or unreliable data for at least one county in the applicable regional group (see Appendix A for details).
Determinants of Health
Indicator results include High School Completion*, Some College*, Children Living in Poverty, Children Enrolled in Free or Reduced Lunch Program, Children Living in Single-Parent Households, Median Household Income*, Unemployment, Homeownership*, Overcrowded Housing, Severe Housing Cost Burden, Adverse Childhood Experiences, Residential Segregation Index (Non-White/White), Income Inequality, Exercise Opportunities*, Not Proficient in English, Rural, Broadband Access*, Social Associations*, Drinking Water Violations, Drinking Water Contaminants, Pesticides, Air- Toxic Chemical Release from Facilities, Air- Maximum 8 Hour Ozone Particulate Matter, Air- Diesel Particulate Matter, Food Insecurity, Limited Access to Healthy Food, Food Environment Index (0 to 10)*, Uninsured (Adults and Children), Uninsured Adults, Uninsured Children, Physical Exam (Self-Report)*, Dental Visit (Self-Report)*, Primary Care Physicians*, Other Primary Care Providers*, Mental Health Providers*, Dentists*, Preventable Hospital Stays, Early Prenatal Care*, Adequate Prenatal Care*, Annual Flu Vaccinations*, Lack of Physical Activity (Self-Report), Insufficient Sleep (Self-Report), Excessive/Binge Drinking (Self-Report), and Smoking (Self-Report).
Health Outcomes
Health outcome indicators include Frequent Physical Distress, Premature Deaths, Years of Potential Life Lost, Child Deaths, Cancer Diagnosis, Breast Cancer Deaths, Colorectal Cancer Deaths, Lung Cancer Deaths, Prostate Cancer Deaths, Chronic Kidney Disease Diagnosis, Chronic Liver Disease & Cirrhosis Deaths, Chronic Obstructive Pulmonary Disease Diagnosis, Chronic Lower Respiratory Disease Deaths, Asthma Diagnosis, Asthma ER Visits, Coronary Heart Disease Diagnosis, Cardiovascular Disease ER Visits, Coronary Heart Disease Deaths, High Blood Pressure Diagnosis, Stroke Diagnosis, Stroke Deaths, Obesity, Diabetes Diagnosis, Diabetes Prevalence, Diabetes Deaths, Gonorrhea Incidence, Syphilis Incidence, Congenital Syphilis Incidence, Chlamydia Diagnosis and Incidence, HIV Prevalence, Infant Death Rate, Low Birth Weight Infants, Teen Birth Rate, Total Tooth Loss, Drug Overdose Deaths, Frequent Mental Distress, Alcohol-Impaired Driving Deaths, Motor Vehicle Accident Deaths, Accident/Unintentional Injury Deaths, Violent Crime, Homicides, Gun-Related Deaths, and Suicides. Data periods, group values, and differences are detailed in the report tables and Appendix B.
Summary of Results
For most indicators- both social determinants and health outcomes- the San Joaquin Valley region fares worse than other California counties, often by a large difference.
Of the 98 indicators measured, the twelve-county SJV region shows the greatest need for investment and resources on 87 indicators (89%).
The table below lists these indicators and shows the difference between the region and the rest of the state for each.
Indicators for Which the SJV Average Fares Worse Than the Non-SJV County Average
Determinants of Health: High School Completion*; Some College*; Children Living in Poverty; Children Enrolled in Free or Reduced Lunch Program; Children Living in Single-Parent Households; Median Household Income*; Unemployment; Homeownership*; Overcrowded Housing; Adverse Childhood Experiences (Adult Retrospective); Exercise Opportunities*; Not Proficient in English; Rural Residency; Broadband Access; Social Associations*; Drinking Water Violations; Drinking Water Contaminants; Pesticides; Air- Ozone Concentration; Food Insecurity; Limited Access to Healthy Food; Food Environment Index (0 to 10)*; Uninsured (All Under Age 65); Uninsured Adults; Annual Physical Exam*; Dental Visits*; Primary Care Physicians*; Other Primary Care Providers*; Mental Health Providers*; Dentists*; Preventable Hospital Stays; Early Prenatal Care*; Lack of Physical Activity; Insufficient Sleep; and Smoking.
Health Outcomes: Frequent Physical Distress; Premature Deaths; Years of Potential Life Lost; Child Deaths; Breast Cancer Deaths; Lung Cancer Deaths; Chronic Kidney Disease; Chronic Liver Disease & Cirrhosis Deaths; Chronic Obstructive Pulmonary Disease; Chronic Lower Respiratory Disease Deaths; Asthma Diagnosis; Asthma ER Visits; Coronary Heart Disease; Coronary Heart Disease ER Visits; Coronary Heart Disease Deaths; High Blood Pressure; Strokes; Stroke Deaths; Obesity; Diabetes Diagnosis (Self-Report); Diabetes; Diabetes Deaths; Syphilis (Males); Congenital Syphilis; Chlamydia (1 Year); Chlamydia (3 Years); Infant Deaths (3 Years); Infant Deaths (7 Years); Low Birth Weight Infants (3 Years); Teen Births (3 Years); Teen Births (7 Years); Total Tooth Loss; Frequent Mental Distress; Alcohol-Impaired Driving Deaths; Motor Vehicle Accident Deaths (3 Years); Motor Vehicle Accident Deaths (7 Years); Violent Crime; Homicides (3 Years); and Homicides (7 Years).
For ten additional indicators, however, the disparity between the value for the eight Central SJV counties and that for the four SJV-Adjacent counties was large enough to skew the number for the twelve-county SJV region so that it appears at first glance that the Non-SJV county group fares the worst when, in reality, one of the SJV subregions actually fares worse.
On six of these ten indicators, SJV-Adjacent counties fare the worst, while the Central SJV counties fare the worst on four.
| SJV-Adjacent Fares Worst | Central SJV Fares Worst |
|---|---|
| Uninsured children Excessive drinking Cancer diagnosis (all except skin cancer) Accident/injury deaths (both 3- and 5-year rates) Gun-related deaths (5-year rate only) Suicides (both 3- and 5-year rates) |
Air pollution- toxic chemical release Colorectal cancer Gonorrhea Low birthweight infants (1 year rate only) |
The twelve-county SJV region genuinely did fare better than Non-SJV counties on the following nine indicators:
- Residential segregation (white/non-white)
- Income inequality
- Flu vaccinations
- Adequate prenatal care
- Air pollution- diesel particulate matter
- Prostate cancer deaths
- HIV (both 1- and 3-year rates)
- Drug overdose deaths (both sources)
- Gun-related deaths (3-year rate only)
For the greatest number of indicators, the eight Central SJV counties fare worse than all other regional groups.
The table below lists the 65 indicators for which Central SJV counties fare the worst, as well as the difference between this group and the regional group faring the best in the analysis- that with the highest or lowest value, depending on the indicator (i.e., 75% of adults in Central SJV counties have completed high school, while 88% of adults in SJV-Adjacent counties have; SJV-Adjacent counties had the highest percentage of all groups on this indicator and the difference between the two groups is 13%).
Indicators for Which Central SJV Counties Fare the Worst
Determinants of Health: High School Completion*; Some College*; Children Living in Poverty; Children Enrolled in Free Lunch Program; Children Living in Single-Parent Households; Median Household Income*; Unemployment; Homeownership*; Overcrowded Housing; Severe Housing Cost Burden; Adverse Childhood Experiences (Adults); Not Proficient in English; Broadband Access*; Social Associations*; Drinking Water Violations; Drinking Water Contaminants; Pesticides; Air- Toxic Chemical Release from Facilities; Air- Ozone Concentration; Food Insecurity; Food Environment Index (0 to 10)*; Uninsured (Adults and Children); Uninsured Adults; Dental Visit*; Dentists; Preventable Hospital Stays; Lack of Physical Activity; Insufficient Sleep; and Smoking.
Health Outcomes: Frequent Physical Distress; Premature Deaths; Years of Potential Life Lost; Breast Cancer Deaths; Colorectal Cancer Deaths; Lung Cancer Deaths; Chronic Kidney Disease; Chronic Liver Disease & Cirrhosis Deaths; Chronic Obstructive Pulmonary Disease; Chronic Lower Respiratory Disease Deaths; Asthma Diagnosis; Asthma ER Visits; Coronary Heart Disease; Coronary Heart Disease Deaths; High Blood Pressure; Strokes; Stroke Deaths; Obesity; Diabetes (Self-Report); Diabetes; Diabetes Deaths; Gonorrhea (Males); Syphilis (Males); Congenital Syphilis; Chlamydia (1 Year Average); Chlamydia (3 Year Average); Infant Deaths (3 Year Average); Low Birth Weight Infants (3 Year Average); Low Birth Weight Infants (7 Year Average); Teen Births (3 Year Average); Teen Births (7 Year Average); Total Tooth Loss; Frequent Mental Distress; Violent Crimes; Homicides (3 Year Average); and Homicides (7 Year Average).
The four SJV-Adjacent counties fare the worst on the indicators listed in the table below. Although the Rural Residency indicator is not included in the table, the SJV-Adjacent sub-region has the highest percentage of people living in rural areas (48% more people in these counties live in a rural area than in the Central-SJV subregion, for instance). The rurality of these counties is likely strongly related to their results on other indicators, such as low rates of healthcare providers and high rates of motor-vehicle accident death.
Indicators for Which SJV-Adjacent Counties Fare the Worst
Determinants of Health: Exercise Opportunities*; Limited Access to Healthy Food; Uninsured Children; Physical Exam*; Primary Care Physicians*; Other Primary Care Providers*; Mental Health Providers*; Early Prenatal Care (3 Year Average)*; and Excessive/Binge Drinking.
Health Outcomes: Child Deaths; Cancer Diagnosis (All Except Skin); Cardiovascular Disease ER Visits; Infant Deaths (7 Year Average); Alcohol-Impaired Driving Deaths; Motor Vehicle Accident Deaths (3 Year Average); Motor Vehicle Accident Deaths (7 Year Average); Accident/Unintentional Injury Deaths (3 Year Average); Accident/Unintentional Injury Deaths (5 Year Average); Gun-Related Deaths (5 Year Average); Suicides (3 Year Average); and Suicides (5 Year Average).
The twelve-county SJV region was split on many indicators, with one of the sub-regions (the Central SJV counties or the SJV-Adjacent counties) faring the best and the other faring the worst. In most of these cases, the SJV-Adjacent counties fare better than Non-SJV counties. For some indicators, however, the Central SJV sub-region fare the best out of all regional groups and the SJV-Adjacent counties fare the worst.
Indicators for which SJV-Adjacent counties fare best, while Central SJV counties fare the worst:
| Determinants of Health | Health Outcomes |
|---|---|
| High school completion Homeownership Overcrowded housing Severe housing cost burden Adverse childhood experiences Not English proficient Social associations Pesticides Air pollution- toxic chemical release Food Environment Index Uninsured (adults and children) Uninsured adults Dental exams Preventable hospital stays Lack of physical activity Insufficient sleep |
Frequent physical distress Premature deaths Colorectal cancer deaths Chronic kidney disease Chronic liver disease and cirrhosis deaths Chronic lower respiratory disease deaths Obesity Diabetes Diabetes deaths Gonorrhea (males) Syphilis (males) Chlamydia Low birthweight infants Teen births (1 year rate only) High blood pressure Strokes Stroke deaths Total tooth loss Violent crime Homicides |
(In addition, data was missing for congenital syphilis for SJV-Adjacent counties due to low numbers, while Central SJV counties had a much higher average rate than Non-SJV counties and the state overall).
Indicators for which SJV-Adjacent counties fare the worst, while Central SJV counties fare the best:
| Determinants of Health | Health Outcomes |
|---|---|
| Uninsured children Early prenatal care Excessive drinking |
Cancer diagnosis (all except skin cancer) Accident/unintentional injury deaths Gun-related deaths Suicides |
(As mentioned previously, SJV-Adjacent counties had the highest percentage of people living in a rural area, as well).
Conclusions and Recommendations
The findings of this analysis show clearly that residents of the San Joaquin Valley region have an elevated need for support in relation to the rest of California in many areas related to health, lifespan, and well-being.
Of the 98 indicators selected for analysis, 87 (89%) show greater need for Valley residents (80% of the 44 metrics for social determinants of health and 87% of the 45 metrics for health outcomes), especially those living in the region’s eight most central counties.
Not only do San Joaquin Valley residents have shorter lifespans than residents in other parts of California, but the quality of their lives and their access to necessary and important resources and opportunities appears to be lower as well.
We have learned from an expansive body of research that health is determined largely by the social conditions we find ourselves in, based on where we live at all levels- from the home we live in to the nation we live in. The findings presented here show notable disparities in the social determinants of health in multiple areas of life, including education, economic well-being, pollution, and access to healthy foods. It is not therefore surprising that regional disparities related to health outcomes were also found in this analysis, with the San Joaquin Valley region having the greatest need for support in improving outcomes of health for all its residents.
Recommendations
1. Policy Development and Implementation
Effective policy development must consider existing burdens faced by the San Joaquin Valley and must account for existing inequities. Policy development and implementation of policies should be driven by dynamic collaboration between public health experts, San Joaquin Valley residents, and community-based organizations. Effective communication with policymakers must include region-specific data presented in a way that is values-driven and digestible. The following actions are recommended by the San Joaquin Valley Public Health Consortium:
- Develop and implement data-driven policies at all levels of government that address the especially high needs of the region’s under-resourced residents and emphasize addressing the root causes of poor health outcomes and inequity in both health and social outcomes.
- Work to identify and then alter policies that contribute to inequitable outcomes in the San Joaquin Valley, including policies that allow racial and ethnic disparities to persist and thrive.
2. Infrastructure Development and Support
To truly address the inequitable health and social outcomes in the San Joaquin Valley, the region needs a significant influx of investment to propel it into sustainable solutions for complex health and social issues. Investment simply made on a per-capita basis may allow the region to maintain the status quo but will not be sufficient for addressing inequity or allowing the region to catch up to the rest of the state. We therefore recommend the following activities:
- Advocate for investment relative to the level of inequities. An entire region is facing inequitable health and social outcomes and addressing these outcomes for the long term will require disproportionate, upfront investment at national, state, and county levels.
- Develop flexible and adequate support for rural parts of the San Joaquin Valley and adjoining counties, especially in the realms of Emergency Medical Services and public health and healthcare workforce development.
3. Region-Driven Research
While this report easily demonstrates the disparities experienced by the region as a whole, a lack of region-specific data (especially demographic data) contributes to a lack of understanding of the unique experiences of San Joaquin Valley residents and glosses over disparities that exist among different demographic groups within the region itself that may or may not be reflected at the state and national level. Furthermore, to identify effective solutions to inequitable health and social outcomes, it is critical to understand the unique causal and systemic pathways that exist in the region between a variety of social and health outcomes, and for this, accurate and aggregated regional data is necessary. The following actions are recommended:
- Expand research capacity and funding for research within the region: research efforts should be led by those living and working in the region and should be informed by community members
- Pursue additional research analyzing the impact of social determinants on health outcomes in the San Joaquin Valley: Research efforts should include investigation of specific causal pathways that lead to inequitable outcomes both within the region and in comparison to other regions (i.e., how poverty and health insurance access in the Valley impact maternal and infant health).
- Expand limited race/ethnicity categories included in surveys, records, and other data collection instruments to reflect the diversity of the region more effectively.
Appendices
A. Missing/Unreliable Data
Missing/Unreliable Data by Indicator and Data Source
CHSP
Unreliable- relative standard error greater than or equal to 23%
No data/events- zero events or suppressed values due to low numbers
| Indicator | Number of SJV Counties with Missing or Unreliable Values | Number of Non-SJV Counties with Missing Values | SJV Counties |
|---|---|---|---|
| Early Prenatal Care | 0 | 1 no data/events | |
| Adequate Prenatal Care | 0 | 1 unreliable | |
| Breast Cancer Deaths | 2 unreliable | 11 unreliable; 2 no data/events | Unreliable- Mariposa, San Benito |
| Colorectal Cancer Deaths | 2 unreliable | 10 unreliable; 1 no data/events | Unreliable- Mariposa, San Benito |
| Lung Cancer Deaths | 0 | 6 unreliable | |
| Prostate Cancer Deaths | 2 unreliable | 11 unreliable; 1 no data/events | Unreliable- Mariposa, San Benito |
| Chronic Liver Disease Deaths | 2 unreliable | 9 unreliable | Unreliable- Mariposa, San Benito |
| Chronic Lower Respiratory Disease Deaths | 0 | 3 unreliable | |
| Heart Disease Deaths | 0 | 3 unreliable | |
| Stroke Deaths | 0 | 6 unreliable | |
| Diabetes Deaths | 1 unreliable | 6 unreliable; 2 no data/events | Unreliable- Mariposa |
| Gonorrhea Incidence (Males) | 1 unreliable | 5 unreliable; 4 no data/events | Unreliable- Mariposa |
| Syphilis Incidence (Males) | 3 no data/events | 3 unreliable; 14 no data/events | No data/events- Calaveras, Mariposa, San Benito |
| Congenital Syphilis Incidence | 1 unreliable; 7 no data/events | 1 unreliable; 38 no data/events | Unreliable- Tulare; No data/events- Calaveras, Kings, Madera, Mariposa, Merced, San Benito, Tuolumne |
| Chlamydia Incidence | 0 | 1 unreliable | |
| HIV Prevalence | 0 | 3 unreliable | |
| Infant Deaths | 4 no data/events | 5 unreliable; 16 no data/events | No data/events- Calaveras, Mariposa, San Benito, Tuolumne |
| Low Birth Weight Infants | 0 | 1 unreliable; 2 no data/events | |
| Teen Births | 0 | 2 unreliable; 2 no data/events | |
| Drug Overdose Deaths | 1 unreliable | 11 unreliable | Unreliable- Mariposa |
| MVA Deaths | 1 unreliable | 11 unreliable | Unreliable- Mariposa |
| Accident/Injury Deaths | 0 | 3 unreliable | |
| Homicide | 3 unreliable; 1 no events | 21 unreliable; 2 no data/events | No data/events- Calaveras, San Benito, Tuolumne; Mariposa |
| Gun-Related Deaths | 4 unreliable | 13 unreliable | Unreliable- Calaveras, Mariposa, San Benito, Tuolumne |
| Suicide | 2 unreliable | 10 unreliable | Unreliable- Mariposa, San Benito |
County Health Rankings
| Indicator | Number of SJV Counties with Missing Values | Number of Non-SJV Counties with Missing Values | SJV Counties / Explanation |
|---|---|---|---|
| Residential Segregation Index | 0 | 2 | A missing value is reported for counties with non-White populations less than 100 in the five-year period. |
| Years of Potential Life Lost | 0 | 2 | A missing value is reported for counties with fewer than twenty deaths in the three-year period. |
| Child Deaths | 1 | 6 | No data- Mariposa. A missing value is reported for counties with fewer than ten child deaths in the four-year period. |
| HIV Prevalence | 0 | 2 | A missing value is reported for counties with 1 to 4 HIV cases in the one-year period. |
| Low Birth Weight Infants | 0 | 1 | A missing value is reported for counties with fewer than ten low birthweight births in the seven-year period. |
| Teen Births | 0 | 1 | A missing value is reported for counties with fewer than ten teen births in the seven-year period. |
| Drug Overdose Deaths | 1 | 6 | No data- Mariposa. A missing value is reported for counties with fewer than ten drug poisoning deaths in the three-year period. |
| MVA Deaths | 0 | 3 | A missing value is reported for counties with fewer than ten motor vehicle crash deaths in the seven-year period. |
| Homicide Rate | 1 | 7 | No data- Mariposa. A missing value is reported for counties with fewer than ten homicide deaths in the seven-year period. |
| Gun-Related Deaths | 0 | 5 | A missing value is reported for counties with fewer than ten firearm fatalities in the five-year period. |
| Suicide Rate | 0 | 3 | A missing value is reported for counties with fewer than ten suicide deaths in the five-year period. |
There were no missing or unreliable data values reported in the PLACES, CalEnviroscreen, or KidsData datasets.
B. Data Sources and Years
List of Indicators, with Years and Sources
Determinants of Health
| Indicator | Data Sources | Year(s) |
|---|---|---|
| High School Completion | County Health Rankings- American Community Survey, 5-year Estimates | 2015-2019 |
| Some College | County Health Rankings- American Community Survey, 5-year Estimates | 2015-2019 |
| Children in Poverty | County Health Rankings- Small Area Income and Poverty Estimates | 2019 |
| Children Enrolled in Free or Reduced Lunch Program | County Health Rankings- National Center for Education Statistics | 2018-2019 |
| Children Living in Single Parent Households | County Health Rankings- American Community Survey, 5-year Estimates | 2015-2019 |
| Median Household Income | County Health Rankings- Small Area Income and Poverty Estimates | 2019 |
| Unemployment | County Health Rankings- Bureau of Labor Statistics | 2019 |
| Homeownership | County Health Rankings- American Community Survey, 5-year estimates | 2015-2019 |
| Overcrowded Housing | County Health Rankings- Comprehensive Housing Affordability Strategy (CHAS) data | 2013-2017 |
| Severe Housing Cost Burden | County Health Rankings- American Community Survey, 5-year Estimates | 2015-2019 |
| Adverse Childhood Experiences | KidsData- UC Davis Violence Prevention Research Program, tabulation of data from the California Behavioral Risk Factor Surveillance System and American Community Survey | 2011-2017 |
| Residential Segregation Index | County Health Rankings- American Community Survey, 5-year estimates | 2015-2019 |
| Income Inequality Ratio | County Health Rankings- American Community Survey, 5-year estimates | 2015-2019 |
| Exercise Opportunities | County Health Rankings- Business Analyst, Delorme map data, ESRI, & US Census Tigerline Files | 2010 & 2019 |
| Not English Proficient | County Health Rankings- American Community Survey, 5-year Estimates | 2015-2019 |
| Rural | County Health Rankings- Census Population Estimates | 2010 |
| Broadband Access | County Health Rankings- American Community Survey, 5-year Estimates | 2015-2019 |
| Social Associations | County Health Rankings- County Business Patterns | 2018 |
| Drinking Water Violations | County Health Rankings- Safe Drinking Water Information System | 2019 |
| Drinking Water Contaminants Index | CalEnviroscreen 4.0- Tracking California - Water Boundary Tool (WBT), Public Land Survey System – Townships, California State Water Resources Control Board (SWRCB) – Safe Drinking Water Information System (SDWIS), EDT Library and Water Quality Analyses Data and Download Page, Permits, Inspections, Compliance, Monitoring and Enforcement (PICME) database, California Department of Public Health (database is no longer in active use), California State Water Resources Control Board (SWRCB) – Groundwater Ambient Monitoring and Assessment (GAMA) Program’s Groundwater Information System | 2011-2019 |
| Pesticides | CalEnviroscreen 4.0- Pesticide Use Reporting, California Department of Pesticide Regulation (DPR) | 2016-2018 |
| Toxic Chemical Release from Facilities | CalEnviroscreen 4.0- Toxics Release Inventory (TRI), US Environmental Protection Agency (US EPA) | 2014-2016 |
| Air- Ozone Concentration | CalEnviroscreen 4.0- Air Monitoring Network, California Air Resources Board (CARB) | 2016-2018 |
| Air- Diesel Particulate Matter | CalEnviroscreen 4.0- EMission FACtors (EMFAC) model2017, the 2016 CEPAMv1.05 Inventory for criteria pollutants, and the California Emissions Inventory Development and Reporting System (CEIDARS) 2012 database, California Air Resources Board (CARB) | 2016 |
| Food Insecurity | County Health Rankings- Map the Meal Gap | 2018 |
| Limited Access to Healthy Food | County Health Rankings- USDA Food Environment Atlas | 2015 |
| Food Environment Index | County Health Rankings- USDA Food Environment Atlas, Map the Meal Gap from Feeding America | 2015 & 2018 |
| Uninsured (All) | County Health Rankings- Small Area Health Insurance Estimates | 2018 |
| Uninsured Adults | PLACES- Behavioral Risk Factor Surveillance System | 2018 |
| Uninsured Children | County Health Rankings- Small Area Health Insurance Estimates | 2018 |
| Annual Health Exam | PLACES- Behavioral Risk Factor Surveillance System | 2018 |
| Dental Visit | PLACES- Behavioral Risk Factor Surveillance System | 2018 |
| Primary Care Physicians | County Health Rankings- Area Health Resource File/American Medical Association | 2018 |
| Other Primary Care Providers | County Health Rankings- CMS, National Provider Identification | 2020 |
| Mental Health Providers | County Health Rankings- CMS, National Provider Identification | 2020 |
| Dentists | County Health Rankings- Area Health Resource File/ National Provider Identification File | 2019 |
| Preventable Hospitalizations | County Health Rankings- Mapping Medicare Disparities Tool | 2018 |
| Early Prenatal Care | County Health Status Profiles- CDPH, 2017 Birth Statistical Master File; CDPH, 2018-2019 California Comprehensive Master Birth Files | 2017-2019 |
| Adequate Prenatal Care | County Health Status Profiles- CDPH, 2017 Birth Statistical Master File; CDPH, 2018-2019 California Comprehensive Master Birth Files | 2017-2019 |
| Flu Vaccinations | County Health Rankings- Mapping Medicare Disparities Tool | 2018 |
| No Leisure-Time Physical Activity | PLACES- Behavioral Risk Factor Surveillance System | 2018 |
| Insufficient Sleep | PLACES- Behavioral Risk Factor Surveillance System | 2018 |
| Excessive/Binge Drinking | PLACES- Behavioral Risk Factor Surveillance System | 2018 |
| Smoking | PLACES- Behavioral Risk Factor Surveillance System | 2018 |
Health Outcomes
| Indicator | Data Sources | Year(s) |
|---|---|---|
| Frequent Physical Distress | PLACES- Behavioral Risk Factor Surveillance System | 2018 |
| Premature Death Rate (3 Years) | County Health Rankings- National Center for Health Statistics - Mortality Files | 2017-2019 |
| Years of Potential Life Lost (3 Years) | County Health Rankings- National Center for Health Statistics - Mortality Files | 2017-2019 |
| Child Death Rate (4 Years) | County Health Rankings- National Center for Health Statistics – Mortality Files | 2016-2019 |
| Cancer Diagnosis, Except Skin | PLACES- Behavioral Risk Factor Surveillance System | 2018 |
| Breast Cancer Death Rate (3 Years) | County Health Status Profiles- CDPH, California Comprehensive Master Death Files, [2017-2019]; CA Department of Finance, Demographic Research Unit, State and County Population Projections 2010-2060 [computer file]. Sacramento, California. January 2020 | 2017-2019 |
| Colorectal Cancer Death Rate (3 Years) | County Health Status Profiles- CDPH, California Comprehensive Master Death Files, [2017-2019]; CA Department of Finance, Demographic Research Unit, State and County Population Projections 2010-2060 [computer file]. Sacramento, California. January 2020 | 2017-2019 |
| Lung Cancer Death Rate (3 Years) | County Health Status Profiles- CDPH, California Comprehensive Master Death Files, [2017-2019]; CA Department of Finance, Demographic Research Unit, State and County Population Projections 2010-2060 [computer file]. Sacramento, California. January 2020 | 2017-2019 |
| Prostate Cancer Death Rate (3 Years) | County Health Status Profiles- CDPH, California Comprehensive Master Death Files, [2017-2019]; CA Department of Finance, Demographic Research Unit, State and County Population Projections 2010-2060 [computer file]. Sacramento, California. January 2020 | 2017-2019 |
| Chronic Kidney Disease Diagnosis | PLACES- Behavioral Risk Factor Surveillance System | 2018 |
| Chronic Liver Disease Death Rate (3 Years) | County Health Status Profiles- CDPH, California Comprehensive Master Death Files, [2017-2019]; CA Department of Finance, Demographic Research Unit, State and County Population Projections 2010-2060 [computer file]. Sacramento, California. January 2020 | 2017-2019 |
| Chronic Obstructive Pulmonary Disease Diagnosis | PLACES- Behavioral Risk Factor Surveillance System | 2018 |
| Chronic Lower Respiratory Disease Death Rate (3 Years) | County Health Status Profiles- CDPH, California Comprehensive Master Death Files, [2017-2019]; CA Department of Finance, Demographic Research Unit, State and County Population Projections 2010-2060 [computer file]. Sacramento, California. January 2020 | 2017-2019 |
| Asthma Diagnosis | PLACES- Behavioral Risk Factor Surveillance System | 2018 |
| Asthma ER Visits (3 Years) | CalEnviroscreen 4.0- Emergency Department and Patient Discharge Datasets from the State of California, Office of Statewide Health Planning and Development (OSHPD) | 2015-2017 |
| Coronary Heart Disease Diagnosis | PLACES- Behavioral Risk Factor Surveillance System | 2018 |
| Cardiovascular Disease ER Visits (3 Years) | CalEnviroscreen 4.0- Emergency Department and Patient Discharge Datasets from the State of California, Office of Statewide Health Planning and Development (OSHPD) | 2015-2017 |
| Coronary Heart Disease Death Rate (3 Years) | County Health Status Profiles- CDPH, California Comprehensive Master Death Files, [2017-2019]; CA Department of Finance, Demographic Research Unit, State and County Population Projections 2010-2060 [computer file]. Sacramento, California. January 2020 | 2017-2019 |
| High Blood Pressure Diagnosis | PLACES- Behavioral Risk Factor Surveillance System | 2017 |
| Stroke Diagnosis | PLACES- Behavioral Risk Factor Surveillance System | 2018 |
| Stroke Death Rate (3 Years) | County Health Status Profiles- CDPH, California Comprehensive Master Death Files, [2017-2019]; CA Department of Finance, Demographic Research Unit, State and County Population Projections 2010-2060 [computer file]. Sacramento, California. January 2020 | 2017-2019 |
| Obesity | PLACES- Behavioral Risk Factor Surveillance System | 2018 |
| Diabetes Diagnosis | PLACES- Behavioral Risk Factor Surveillance System | 2018 |
| Diabetes Prevalence | County Health Rankings- United States Diabetes Surveillance System | 2017 |
| Diabetes Death Rate (3 Years) | County Health Status Profiles- CDPH, California Comprehensive Master Death Files, [2017-2019]; CA Department of Finance, Demographic Research Unit, State and County Population Projections 2010-2060 [computer file]. Sacramento, California. January 2020 | 2017-2019 |
| Gonorrhea Incidence (Males, 3 Years) | County Health Status Profiles- CDPH, California Comprehensive Master Death Files, [2017-2019]; CA Department of Finance, Demographic Research Unit, State and County Population Projections 2010-2060 [computer file]. Sacramento, California. January 2020 | 2017-2019 |
| Syphilis Incidence (Males, 3 Years) | County Health Status Profiles- CDPH, California Comprehensive Master Death Files, [2017-2019]; CA Department of Finance, Demographic Research Unit, State and County Population Projections 2010-2060 [computer file]. Sacramento, California. January 2020 | 2017-2019 |
| Congenital Syphilis Incidence (3 Years) | County Health Status Profiles- CDPH, STD Control Branch. Data Requested, October 2020; CDPH, 2017 Birth Statistical Master File; CDPH, 2018-2019 California Comprehensive Master Birth Files | 2017-2019 |
| Chlamydia Rate | County Health Rankings- National Center for HIV/AIDS, Viral Hepatitis, STD, and TB Prevention | 2018 |
| Chlamydia Incidence (3 Years) | County Health Status Profiles- CDPH, STD Control Branch. Data Requested, October 2020; CDPH, 2017 Birth Statistical Master File; CDPH, 2018-2019 California Comprehensive Master Birth Files | 2017-2019 |
| HIV Prevalence | County Health Rankings- National Center for HIV/AIDS, Viral Hepatitis, STD, and TB Prevention | 2018 |
| HIV Prevalence (3 Years) | County Health Status Profiles- California Department of Public Health, Office of AIDS, Surveillance Section. Data Requested, July 2020. State of California, Department of Finance, Demographic Research Unit, State and County Population Projections 2010-2060 [computer file]. Sacramento, California. January 2020. | 2016-2018 |
| Infant Death Rate (3 Years) | County Health Status Profiles- California Department of Public Health, 2016-2018 Birth Cohort-Perinatal Outcome Files. | 2016-2018 |
| Infant Death Rate (7 Years) | County Health Rankings- National Center for Health Statistics - Mortality Files | 2013-2019 |
| Low Birth Weight Infants (3 Years) | County Health Status Profiles- California Department of Public Health, 2017 Birth Statistical Master File. California Department of Public Health, 2018-2019 California Comprehensive Master Birth Files. | 2017-2019 |
| Low Birth Weight Infants (7 Years) | County Health Rankings- National Center for Health Statistics - Natality files | 2013-2019 |
| Teen Birth Rate (3 Years) | County Health Status Profiles- California Department of Public Health, 2017 Birth Statistical Master File. California Department of Public Health, 2018-2019 California Comprehensive Master Birth Files. State of California, Department of Finance, Demographic Research Unit, State and County Population Projections 2010-2060 [computer file]. Sacramento, California. January 2020. | 2017-2019 |
| Teen Birth Rate (7 Years) | County Health Rankings- National Center for Health Statistics - Natality Files | 2013-2019 |
| Total Tooth Loss | PLACES- Behavioral Risk Factor Surveillance System | 2018 |
| Drug Overdose Death Rate (3 Years) | County Health Status Profiles- California Department of Public Health, California Comprehensive Master Death Files, [2017-2019]. Compiled, October 2020. State of California, Department of Finance, Demographic Research Unit, State and County Population Projections 2010-2060 [computer file]. Sacramento, California. January 2020. | 2017-2019 |
| Drug Overdose Death Rate (3 Years) | County Health Rankings- National Center for Health Statistics - Mortality Files | 2017-2019 |
| Frequent Mental Distress | PLACES- Behavioral Risk Factor Surveillance System | 2018 |
| Alcohol-Impaired Driving Deaths (5 Years) | County Health Rankings- Fatality Analysis Reporting System | 2015-2019 |
| Motor Vehicle Accident Death Rate (3 Years) | County Health Status Profiles- California Department of Public Health, California Comprehensive Master Death Files, [2017-2019]. Compiled, October 2020. State of California, Department of Finance, Demographic Research Unit, State and County Population Projections 2010-2060 [computer file]. Sacramento, California. January 2020. | 2017-2019 |
| Motor Vehicle Accident Death Rate (7 Years) | County Health Rankings- National Center for Health Statistics- Mortality Files | 2013-2019 |
| Accidental Injury Death Rate (3 Years) | County Health Status Profiles- California Department of Public Health, California Comprehensive Master Death Files, [2017-2019]. Compiled, October 2020. State of California, Department of Finance, Demographic Research Unit, State and County Population Projections 2010-2060 [computer file]. Sacramento, California. January 2020. | 2017-2019 |
| Accidental Injury Death Rate (5 Years) | County Health Rankings- National Center for Health Statistics- Mortality Files | 2015-2019 |
| Violent Crime Rate | County Health Rankings- Uniform Crime Reporting – FBI | 2014 & 2016 |
| Homicide Rate (3 Years) | County Health Status Profiles- California Department of Public Health, California Comprehensive Master Death Files, [2017-2019]. Compiled, October 2020. State of California, Department of Finance, Demographic Research Unit, State and County Population Projections 2010-2060 [computer file]. Sacramento, California. January 2020. | 2017-2019 |
| Homicide Rate (7 Years) | County Health Rankings- National Center for Health Statistics - Mortality Files | 2013-2019 |
| Gun-Related Death Rate (3 Years) | County Health Status Profiles- California Department of Public Health, California Comprehensive Master Death Files, [2017-2019]. Compiled, October 2020. State of California, Department of Finance, Demographic Research Unit, State and County Population Projections 2010-2060 [computer file]. Sacramento, California. January 2020. | 2017-2019 |
| Gun-Related Death Rate (5 Years) | County Health Rankings-National Center for Health Statistics - Mortality Files | 2015-2019 |
| Suicide Rate (3 Years) | County Health Status Profiles- California Department of Public Health, California Comprehensive Master Death Files, [2017-2019]. Compiled, October 2020. State of California, Department of Finance, Demographic Research Unit, State and County Population Projections 2010-2060 [computer file]. Sacramento, California. January 2020. | 2017-2019 |
| Suicide Rate (5 Years) | County Health Rankings- National Center for Health Statistics - Mortality Files | 2015-2019 |
This HTML version was generated with AI assistance and may contain errors or omissions. The original approved PDF remains the official document of record. An alternative accessible format is available upon request from the document creator in accordance with Title II of the ADA.