CRDP Sweet Potato Year 2 Evaluation Data Report
PREPARED BY CENTRAL VALLEY HEALTH POLICY INSTITUTE
MAY 2020
Authors: LaMecia Ward, MPH, Sonia Mendoza, Tania Pacheco-Werner, PhD
TABLE OF CONTENTS
- TABLE OF CONTENTS 1
- SWEET POTATO PROJECT 2
- Executive summary 2
- Background and Purpose 2
- Evaluation Component Description 3
- DEMOGRAPHICS 3
- Major Findings 5
- Participant surveys 5
- Youth and Parent Focus Group 12
- Comparison Group 20
- Major Findings 5
- APPENDIX A: METHODS 22
- Local Evaluation Survey 22
- Statewide Evaluation Survey 22
Suggested Citation
Ward, L., Mendoza, S., Pacheco-Werner, T.(2020). CRDP Year 2 Sweet potato project Evaluation Data Report. Central Valley Health Policy Institute. URL: https://chhs.fresnostate.edu/cvhpi/ documents/sweetpotatoyear2.pdf
SWEET POTATO PROJECT
CREATING HOPEFUL, RESILIENT, LEADERS
Executive summary
The Sweet Potato Project is a part of the California Reducing Disparities Project, which seeks to reduce mental health disparities across California. The Sweet Potato Project (SWP) at the West Fresno Family Resource Center is an implementation project that seeks to demonstrate the effectiveness of a culturally relevant approach to addressing mental health disparity in the community of West Fresno. It aims to prevent and/or reduce stigmatization surrounding mental health issues for African American youth ages 10-16 by increasing educational opportunities for young men and women in Southwest Fresno and providing the opportunity to earn money and gain job training through dignified work.
The focus of the club is to instill leadership skills into the students and for them to specifically see themselves as African American leaders. Through mentorship and skill-based farming education, students are in a community surrounding that is intended to promote well-being. It also does so through neighborhood safety, increasing a sense of community, and thus reducing gang activity to the end of supporting a southwest Fresno neighborhood that is safer, and more economically reliant and self-sustainable.
Background and Purpose
The Sweet Potato Project evaluation provides information about how the goals of the CRDP (California Reducing Disparities Project) has been implemented in Fresno’s Sweet Potato Project through the implementation of a “prevention program.” The goal of a prevention program in the CRDP model is to “reduce individual/family or community risk factors or stressors, build protective factors and skills, and increase support; promote positive cognitive, social and emotional development and encourage a state of well-being.” 1 Prevention includes building protective factors and skills, increasing support, and reducing risk factors or stressors prior to a diagnosis of mental illness
The findings need to be framed into two domains that capture both what it means to be an “at-risk” youth, being resilient, and overcoming barriers within neighborhoods and systems where they face challenges. There are things that are in the student’s internal sphere of control, which is not just a mentality of “me having control of what is happening around me,” but speaking to the real things that they can control in the context in which they live. The other domain in which they operate and make decisions is the external sphere of control, which speaks to items that are a reflection of what is happening in their neighborhood, with their family that they are impacted by but do not control directly.
1 California Reducing Disparities Project. 2017. “Phase 2 Statewide Evaluation Guidelines”
Evaluation Component Description
The evaluation examines if participation in the Sweet Potato project has short-term effects that improve African American middle school students’ well-being and academic performance, and longer-term effects in terms of reducing school dropout rates, promoting well-being, positive adult relationships, and leadership skills. The data to describe these outcomes is drawn from surveys with participants and controls at intake, at one and two-year follow-ups, interviews with youths’ parents and other significant adults, and qualitative descriptions by the youth and parents about program and health risk and protective/resilience factors. The evaluation provides training to African American and Latino graduate students as interviewers and focus group co-facilitators. A detailed description of the evaluation component methodology can be found in Appendix A. The figure below describes all evaluation components:
- Local Survey
- SWE Survey
- Sweet Potato Youth Focus Group
- Parent Focus Groups
DEMOGRAPHICS
Figure 1. Age Distribution of Sweet Potato Participants Y1 and Y2
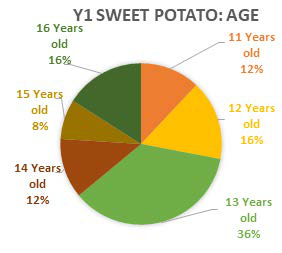
In years one and year two the students participating in the group are mostly middle school-aged. In year 1 64% of participants were between the ages of 12 and 14 years old. However, year two the program had an increase of 76% of participants between the ages of 12 and 14 years old. Similar to year one, the students were mostly African American (72%), with some of the participants also identifying as Latino/Hispanic and Multi-Racial.
Sweet Potato Y2 Race and Ethnicity
| /RaceEthnicity | Number of Students | % of Students |
|---|---|---|
| Black/African American | 13 | 72 |
| Latino/Hispanic | 2 | 11 |
| Multi-Racial | 2 | 11 |
| Don’t Know | 2 | 11 |
In addition, there was a slight decrease in male participants and an increase of female participants in year two (58% male and 42% female students) compared to year one.
Major Findings
Participant surveys
Table 2. Student Survey Question Y1 and Y2 Pre-test and Post-Test: How far would you like to go in School?
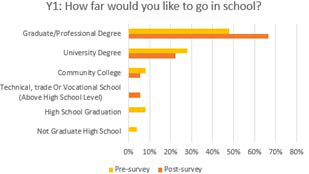
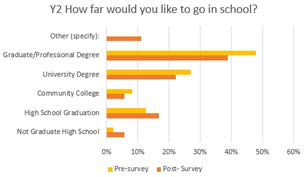
Self-efficacy and hope for the future are key protective mental health factors. Year one data revealed Sweet Potato Participants wanted to go further in their education and have a better sense of overcoming adversity after they participate. However, in Year two data indicates that after the program participants want to go further in their education not just by obtaining a professional or university degree, but also through other opportunities.
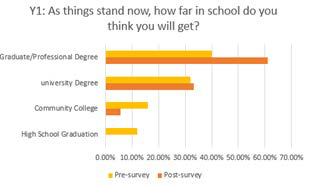
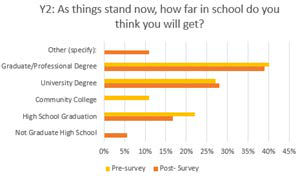
Table 3. Student Survey Question Y1 and Y2 Pre-test and Post-Test: As things stand now, how far would you like to go in School?
Compared to year one data, year two data indicate that after the program participants want to go further in their education not just by obtaining a professional or university degree, but also through other opportunities. The program offers the Sweet potato participants a chance to get educated on the different opportunities to receive higher education and the many resources that gives them the knowledge needed to further their education.
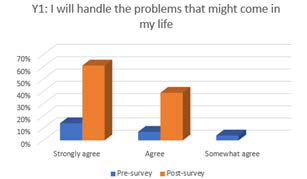
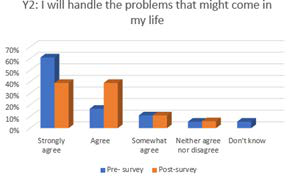
Table 4. Student Survey Question Pre-test and Post-Test: I will handle the problems that might come up in life
Participants were asked to answer how much they agreed with the statement about being able to handle the problems that come up in their life, by the end of year one and year two, most thought they could, indicating self-efficacy. Compared to year one data, year two data reveals there is a drop in strongly agreeing to the statement. Yet, after the participants more than half strongly agreed or agreed with the statement.
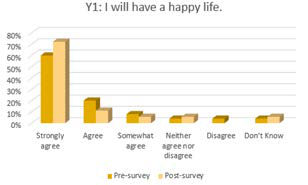
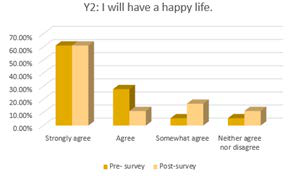
Table 5. Student Survey Question Pre-test and Post-Test: I will have a happy life.
Participants were asked how much they agree with the statement, “I will have a happy life.” By the end of year, two results indicated that the majority of the participants agreed with the statement, indicating hope for the future.
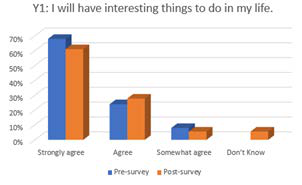
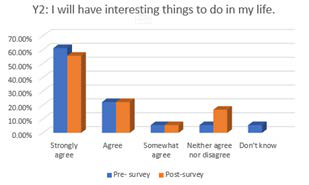
Table 6. Student Survey Question Pre-test and Post-Test: I will have interesting things to do in life.
Participants were asked how much they agree with the statement, “I will have a happy life.” By the end of year, two results indicated that the majority of the participants agreed with the statement, indicating hope for the future.
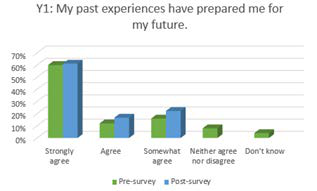
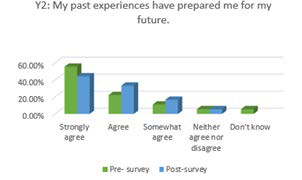
Table 7. Student Survey Question Pre-test and Post-Test: My past experiences have prepared me for my future.
Sweet potato participants were asked how much they agreed with the statement, “My past experiences have prepared me for my future.” In the beginning of the program, in years one and two some of the participants said they didn’t know or neither agreed or disagreed. By the end of the program, the participants mostly agreed with the statement. Participant perceptions about past experiences have changed.
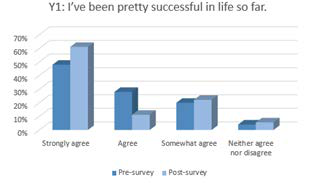
Table 8. Student Survey Question Pre-test and Post-Test:I’ve been pretty successful in life so far.
Sweet potato participants were asked how much they agreed with the statement, “I’ve been pretty successful in life so far.” compared to year one, by the end of the program in year two there was a decrease in strongly agreed statements, however, the majority of the participants strongly agreed, agreed, and somewhat agreed with this statement.
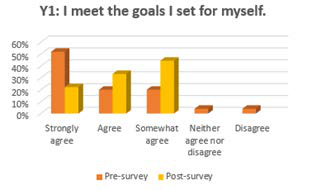
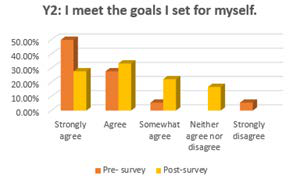
Table 9. Student Survey Question Pre-test and Post-Test:I meet the goals I set for myself.
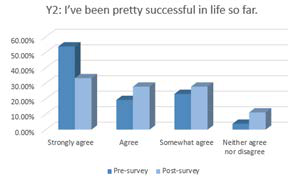
Sweet potato participants were asked how much they agreed with the statement, “I’ve been pretty successful in life so far.” Similar to year one, by the end of the program in year two there was a decrease in strongly agreed statements however the majority of the participants strongly agreed, agreed, and somewhat agreed with this statement.
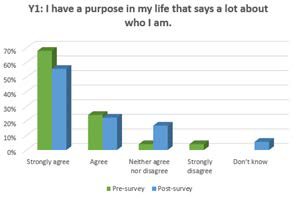
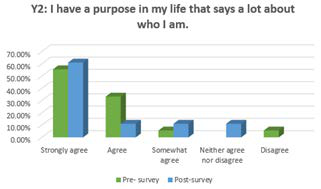
Table 10. Student Survey Question Pre-test and Post-Test: I have a purpose in my life that says a lot about who I am.
Sweet potato participants were asked how much they agreed with the statement, “I have a purpose in my life that says a lot about who I am.” At the beginning of the program, in year one some of the participants said they didn’t know. In year two some participants disagreed with this statement. By the end of the program, the participants mostly agreed with the statement. Participant perceptions about having a purpose in life have changed.
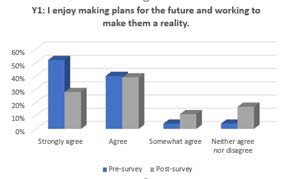
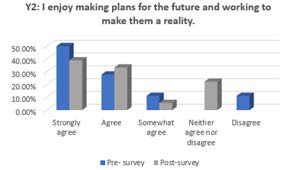
Table 11. Student Survey Question Pre-test and Post-Test: I enjoy making plans for the future and working to make them a reality.
Participants were asked to answer how much they agreed with the statement about enjoying making plans for the future, by the end, most indicated that they agreed with this statement. The results indicate hope for the future.
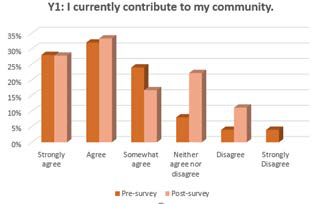
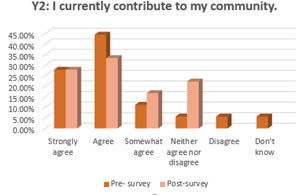
Table 12. Student Survey Question Pre-test and Post-Test: I currently contribute to my community.
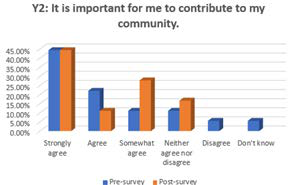
Participants were asked to answer how much they agreed with the statement about the importance of contributing to their communities, by the end, year two participants agreed with this statement compared to year one, indicating a sense of community.
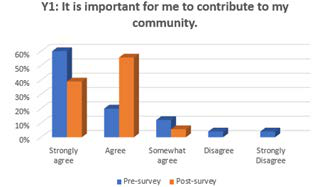
Table 13. Student Survey Question Pre-test and Post-Test: It is important to contribute to my community.
Participants were asked to answer how much they agreed with the statement about the importance of contributing to their communities. By the end, year two participants still strongly agreed with this statement compared to year one, indicating a sense of community.
Table 14. Student Survey Question Pre-test and Post-Test:The friendships I have with other people in my neighborhood mean a lot to me.
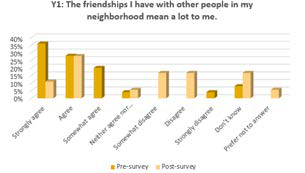
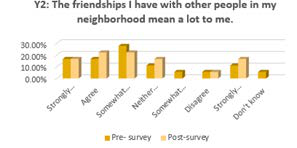
Participants were asked how much they agreed with the statement, “The friendships I have with other people in my neighborhood mean a lot to me.” By the end of the program in year two those who strongly agreed with the statement stayed consistent and there was an increase in participants agreeing with this statement.
Table 15. Student Survey Question Pre-test and Post-Test:I believe my neighbors would help me in an emergency.
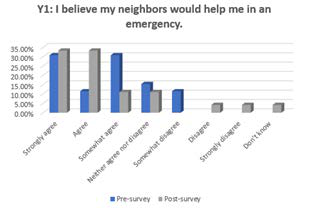
Participants were asked to answer how much they agreed with the statement about their neighbors helping them in an emergency, by the end of year one and year two, most agreed with the statement, indicating a sense of community.
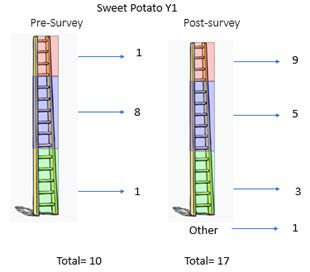
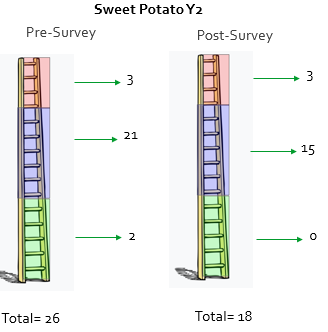
Table 16. Student Survey Question Pre-test and Post-Test: My family’s social status.
Youth participants were asked to select their family’s status on the ladder. The top (red) of the ladder are the people who are best off. They have the most money, highest education, and jobs that have the most respect. The bottom (yellow) of the ladder are the worst off. They have minimal money, minimal education, no jobs, or jobs that bring minimal income. More participants participated in this question in year two. Results reveal that most participants believe that their families are not the worst off but in between well off and worst off. These were the participant’s selections.
Youth and Parent Focus Group
The evaluation examines if participation in the Sweet Potato project has short-term effects that improve students’ well-being and academic performance and longer-term impact in terms of reducing school dropout rates, promoting well-being, positive adult relationships, and leadership skills. As a result, three focus groups were conducted at the West Fresno Family resource Center by a research analysis and a research assistant form Central Valley Health Policy Institute at Fresno State. In Late November and early December two parent focus groups were conducted. A Sweet Potato youth participant focus group was conducted in January 2020. The purpose of the focus groups was to examine the direct outcomes regarding the Sweet Potato Program and how these outcomes have affected those participating in the program. The information provided by the students and parents helped researchers evaluate the program and participant health risks and protective/resilience factors. There were a total of 6 questions that were asked during each focus group, and all responses were kept confidential.
Analysis of the youth focus group questions revealed the following:
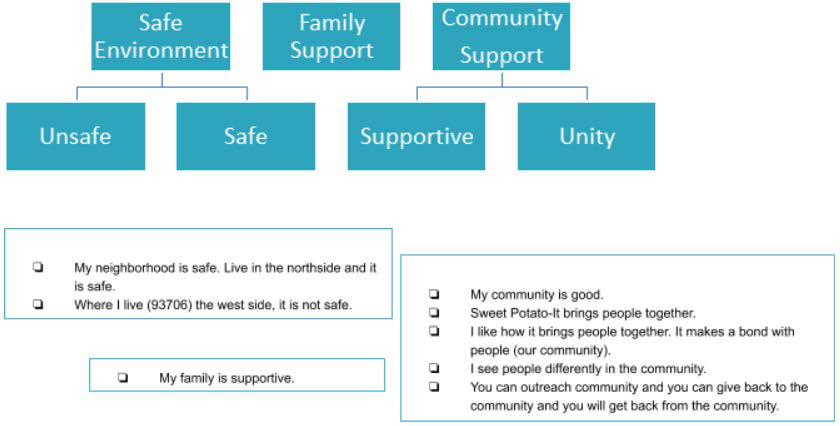
Q.1 Sweet Potato participants were asked to describe their community (i.e. friends, family, church, classmates, and your neighborhood) before participating in the Sweet Potato Program? How has that changed today and how has the program influenced this change if any changes have occurred?
Table 17. Sweet Potato Youth Focus Group Question: Community Description
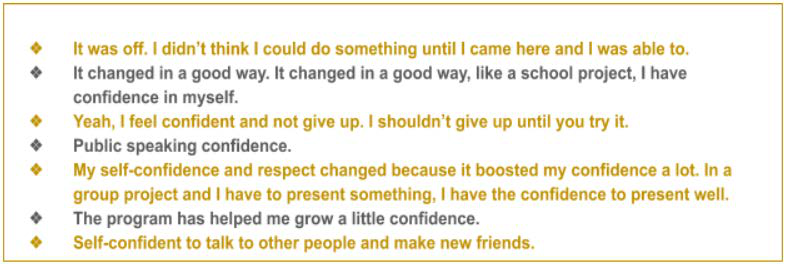
Q.2 Sweet Potato participants were asked to describe their self-confidence (i.e. a feeling of trust in one’s abilities, doing things that you never thought you would ever do before) and self-respect (i.e. believing in yourself, believing that you are worthy of being treated well) before and after the program? By the end of the program everyone reported “Increased Self-Esteem.”
Table 18. Sweet Potato Youth Focus Group Question: Self-confidence/ Self-respect
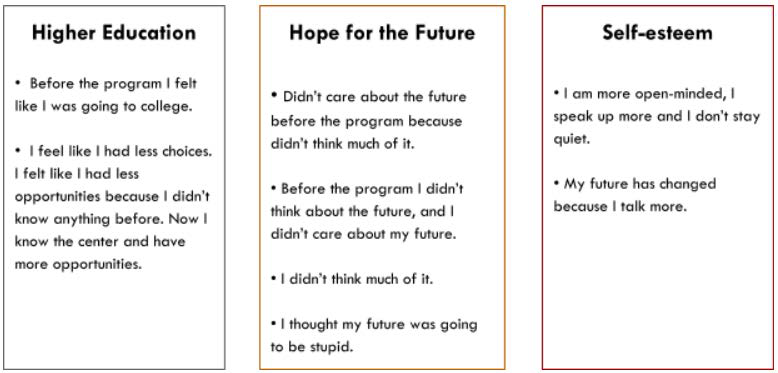
Q.3 Sweet Potato participants were asked to describe their future before participating in the Sweet potato Program and how it has changed after the program if any changes have occurred? The youth participants' response reflected increased interest in higher education, hope for the future and increased self-esteem.
Table 19. Sweet Potato Youth Focus Group Question: Description of the Future
Q.4 Sweet Potato participants were asked to describe their professional career goals before participating in the program and explain how has the program influenced changes if any have occurred? Most participants indicated that the program had an impact on their views on higher education and entrepreneurship.
Table 20. Sweet Potato Youth Focus Group Question: Professional career goals
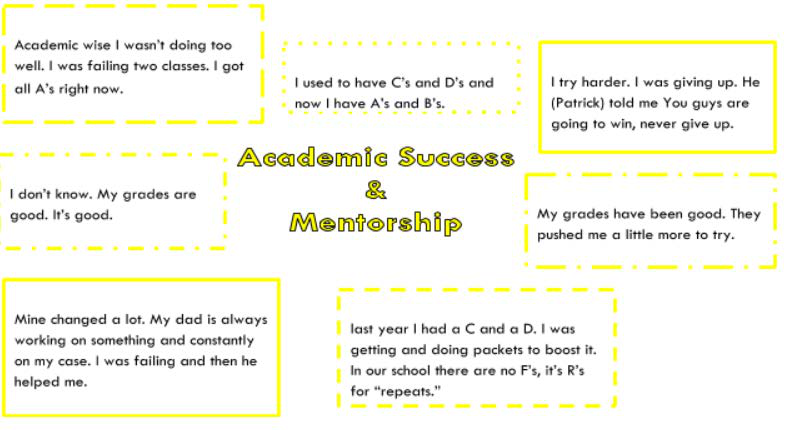
Q.5 Sweet Potato participants were asked What were some concerns you had about your academic or professional future, and about your neighborhood before participating in the program? How has participating in the sweet Potato Program helped you overcome these barriers? The youth responses reflect concerns about Academic success and mentorship as shown in Table 21.
Table 21. Sweet Potato Youth Focus Group Question: Concerns for the future
Q.6 Sweet Potato participants were asked what has the Sweet Potato Project helped you learn to do better since you have been meeting? The word cloud in Table 22. reflects the participant responses.
Table 22. Sweet Potato Youth Focus Group Question: Learned skills
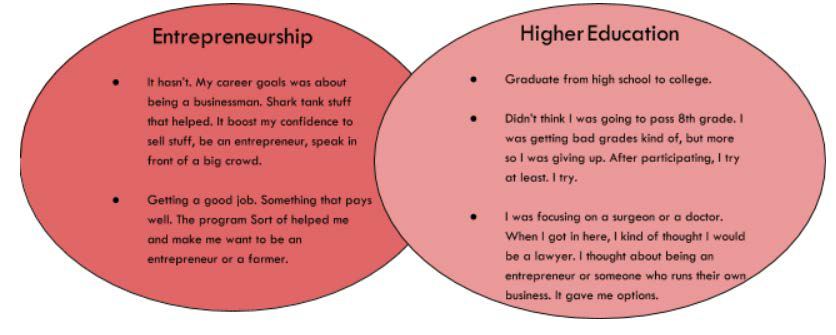
The responses given by the youth participants indicate that prior to Sweet Potato most youth did not care to think of or plan for the future. However, participating in the Sweet Potato program has increased their self-esteem, their interest in higher education, and hope for the future. The Sweet potato program has afforded these youth a supportive community and a safe environment to help develop young African American leaders.
Parent Focus Group
In December 2019, CVHPI conducted a focus group with six parents of students from the SWP. Parents were asked to discuss the improvements they had seen in their children since they became part of SWP, how they thought African American values and culture were expressed as part of the project, and any additional comments.
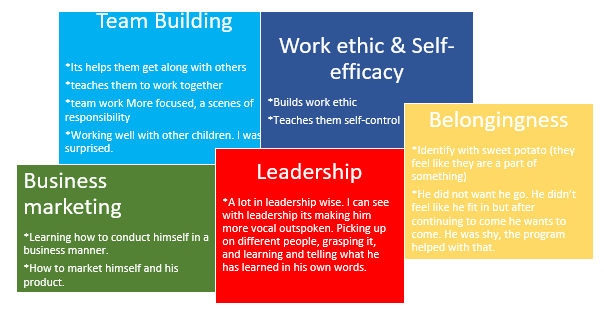
Q1. Parents were asked how has the Sweet Potato Project helped their child or children improve and grow as a person? (As a student? As a young person in their community? Leadership?) The diagram below captures the various themes that parents expressed as they saw improvements among their child or children.
Table 23. Sweet Potato Parent Focus Group Question: Child improvements and growth
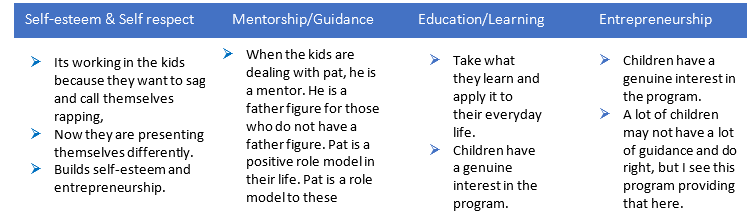
Q2. Parents were asked if they have noticed a change in their child or children talk about their future since participating in the program? In what ways? Parents have demonstrated that the program increases participants' self-esteem. Parents also express how the program provides guidance and it is impactful especially for children who lack mentorship opportunities and guidance. In addition, parents see a real interest in their child or children while in the program.
Table 24. Sweet Potato Parent Focus Group Question: Change in child’s future
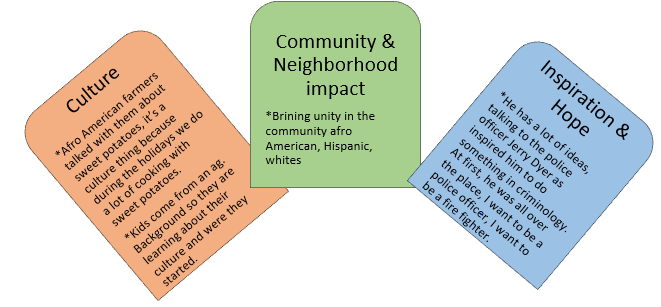
Q3. Parents were asked how they saw African American cultural values being expressed and taught throughout the program? While the parents explain how the program has increased cultural awareness, they also added how the program brings unity to the community and inspires kids and gives them hope for the future.
Table 25. Sweet Potato Parent Focus Group Question: Cultural Values Expressed in Sweet Potato
Q4. Parents were asked if they believe the Sweet Potato Project has helped change your community and in what ways? The parents believed the center provided community solidarity as one parent stated,” It’s good that a lot of people come together and try to show the kids more.” Others also believed the program offers children hope for higher education, career guidance, and professional experiences. Also, Parents believe the center “provides a safe place, provides guidance,” and “If things are going bad at home, children can come to the center to get help and get a piece of mind.”
Table 26. Sweet Potato Parent Focus Group Question: Sweet Potato’s impact in the Community
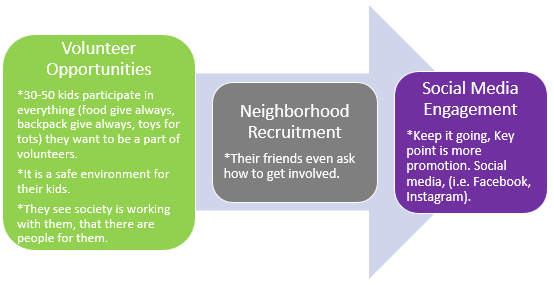
Q5. Parents were asked to provide feedback and ideas to further improve the program that can potentially help their child and improve their future. Parents' responses suggested the program increase volunteer opportunities for children even during the times the program is not running. In addition, parents believe the program should increase social media engagement and neighborhood recruitment.
Table 27. Sweet Potato Parent Focus Group Question: Ideas for future improvements to Sweet Potato

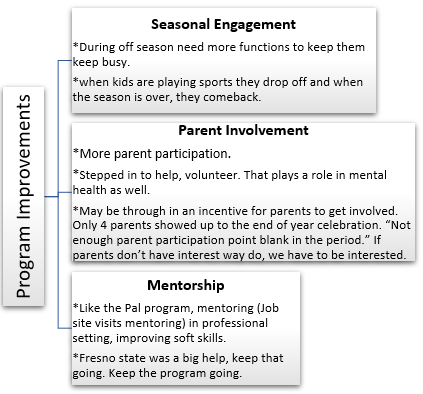
Q6. Parents were asked if they had any more comments or anything to say about the program? Parents suggested that the program increase seasonal engagement, as well as increasing parent and community engagement. Parents also believe that incorporating mentorship with local partners around Fresno would be great for children to increase soft skills and gain professional skills.
Table 28. Sweet Potato Parent Focus Group Question: Ideas for future improvements to Sweet Potato
Parents report that they are first-hand witnessing personal growth and improvement from their child or children participating in the Sweet Potato Project. The Sweet potato program has created a positive and supportive community that has enabled youth participants to gain a sense of hope, motivation, and the capability to refrain from affiliating one’s self with troubling groups in their community. Mentorship and social support was thoroughly mentioned throughout the series of questions. This positive impact can inspire a future generation and allow other community members to positively influence youth participants.
The development of the curriculum was centralized around business management, marketing, economics, and field trips taken by the youth participants. The executive director of West Fresno Family Resource Center envisioned the curriculum along with program director Patrick, and the Fresno State faculty. According to the findings, Afrocentric cultural values and history were incorporated into Year two of the summer program. The executive director of West Fresno Family Resource Center not only centered the summer program around business, marketing strategies and collaboration but also around “Afro American farming.” During the focus groups parents mentioned that during the summer program “Afro American” farmers talked with the children about sweet potatoes. Sweet potatoes are significant in the African American community because during the holidays many do a lot of cooking with sweet potatoes. Some of the youth participants were identified as coming from families with agricultural backgrounds. This experience gave the youth an opportunity to explore and learn about their culture and where African American farming began. Youth also had the opportunity to learn and celebrate their culture through participating in selling their sweet potato products during a Juneteenth celebration. This coincides with increased youth participant collaboration in a steady work environment through exploring afro American cultural values. Collaboration and the summer program created value marketing and business strategies, as well as providing the opportunity for youth participants to gain further African American cultural values.
Findings demonstrate that continued improvements in the program are a key priority to sustain the program and encourage the youth participants. Parents recognize that the Sweet Potato Project has the youth invested in their community. Participants noted that the program has brought so many resources and so much positivity to the children. “Losing it now would be a downfall.”
Comparison Group
We also have a comparison group who get weekly motivational messages, but are not in the program. In order to test if the Sweet Potato intervention itself was beneficial on top of just attending the WFFRC, we developed a comparison group. This is a group of students that are from the neighborhood, similar in demographics. We emailed comparison group inspirational quotes from prominent African Americans throughout history. The participants in this group would then let our staff know that they read the quote. Early results point to more self-efficacy, hope for the future, and sense of community from program participants than the comparison group.
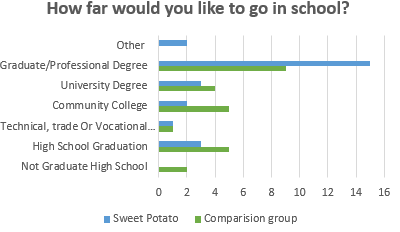
Table 29. Student Survey Question Sweet potato and Comparison group:
The youth were asked to answer how far they would like to go in school. Sweet Potato participants were more inclined to answer that they want to go as far to earn a graduate/professional degree than the comparison group.
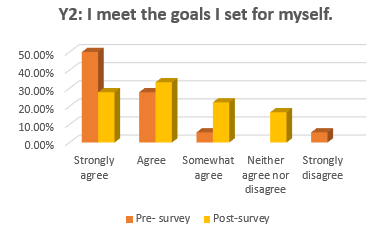
Table 30. Sweet potato and Comparison group question:
Sweet Potato participant data reflects that participants had the highest selection rate for Strongly Agree and were more likely to agree with the statement: I meet the goals I set for myself. This statement implies Sweet Potato participants have increased self-efficacy in contrast to the comparison.
Table 31. Sweet potato and Comparison group question: Important to contribute to community
This data suggests Sweet Potato participants have an increased sense of community as they were significantly more likely to agree with the statement: It is important for me to contribute to my community.
APPENDIX A: METHODS
Local Evaluation Survey
We addressed the survey attempting to ask three research questions. The first research question is “what are social and mental health risk characteristics of Sweet Potato participants and controls?” To answer this question, we collected survey questions on the following mental health risk and resilience domains:
- Substance use
- Gang Involvement
- College Intentions
- School Participation
- Collective efficacy (neighborhood questions)
- Hopefulness
The method also included having a comparison group, so these same questions were asked pre-test and post-test for both the sweet potato project participants and the comparison. In addition, the participants that are in the club for more than one year are also being tracked and analyzed for significant differences of those participants in the analysis. For the questions, we used tested measures from other sources. See below:
1) Substance use. Youth Risk Behavior Surveillance System (YRBSS)
2) College intentions. Jackson et al National Survey of American Life Adolescent Supplement
3) Gang participation/school performance. National Gang Center: A Guide to Assessing Your Community’s Youth Gang Problem
4) Hope, purpose, contribution to neighborhood, collective efficacy. Stoddard and Peirce (2015)
5) Neighborhood cohesion. Hurd Stoddard and Zimmerman (2013)
6) Family Affluence Scale (FAS) III
Statewide Evaluation Survey
Cultural Connection Scale
Culture means many different things to different people but it is something that is usually shared by a relatively large group of people. For some it refers to customs and traditions. For others, it brings to mind their heritage and way of life. It can refer to beliefs, values and attitudes, your identity, and common history and membership in a group. These questions were assigned to measure how connected the participants are to their culture. For example, participants were asked how their culture gives them strength. We assigned a score of 1 to responses where they strongly disagreed to a statement about cultural connection. A score of 5 to the statements where they strongly agreed. The scale was a 5 point scale. Based on the data, 4 was the lowest possible score and 20 would yield the highest score.
Isolation Scale
Isolation can entail social isolation and feeling disconnected from your social support or culture. These questions were assigned to measure the perceived isolation from school, or marginalized from society. For example, participants were asked if they were marginalized or excluded from society. We assigned a score of 1 to responses where they felt it none of the time. A score of 5 was assigned to the statements where they felt it all the time. The scale was a 5 point scale. Based on the data, 4 was the lowest possible score and 20 would yield the highest score.
Psychological Distress
Psychological distress was measured on a 5 point scale. Participants were asked about if they ever felt they were nervous, hopeless and felt if they were so depressed, nothing could cheer up the participants. We assigned a score of 1 to responses where they felt it none of the time. A score of 5 was assigned to the statements where they felt it all the time. Based on the data, the lowest possible score was 6 and the highest possible score was 30.
Psychological Functioning
Psychological functioning was a 3 point scale. Participants were asked questions about how fears and worries may interfere with their daily lives. We assigned a score of 1 to responses where they felt it none of the time. A score of 3 was assigned to the statements where they felt it all the time. Based on the data, the lowest possible score was 3 and the highest possible will yield 12.
This HTML version was generated with AI assistance and may contain errors or omissions. The original approved PDF remains the official document of record. An alternative accessible format is available upon request from the document creator in accordance with Title II of the ADA.