Central Valley Health Policy Institute
Data & Infographics
-
In addition to reports and publications, Central Valley Health Policy Institute develops presentable materials reflecting data of all sorts across the Central Valley. Feel free to browse below and view the various infographics, posters, and other data presentations that the fantastic team with CVHPI have developed over the years.
Climate and Health Indicators Data Dashboard
Highlights
-
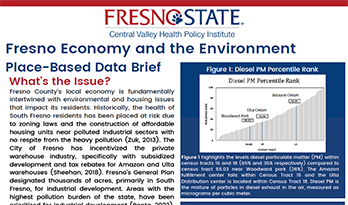
Fresno Economy and the Environment Place-Based Data Brief
May 2024
Updated July 18, 2024
Climate Change
Climate change is a critical issue that disproportionately affects marginalized communities throughout the Central Valley. The region has experienced the consequences of global warming, including arid landscapes, longer droughts, reduced snowpack, and compromised air quality due to industrial activities and wildfires. Additionally, the occurrence of heavy rainfall within shorter periods increases the risk of flooding, creating a precarious environment for all residents.
The following infographics have been created by the staff at CVHPI to present information concerning climate change in the Central Valley.
-

Fresno Economy and the Environment Place-Based Data Brief
May 2024
Updated July 18, 2024 -
Community Climate Survey
January 2024
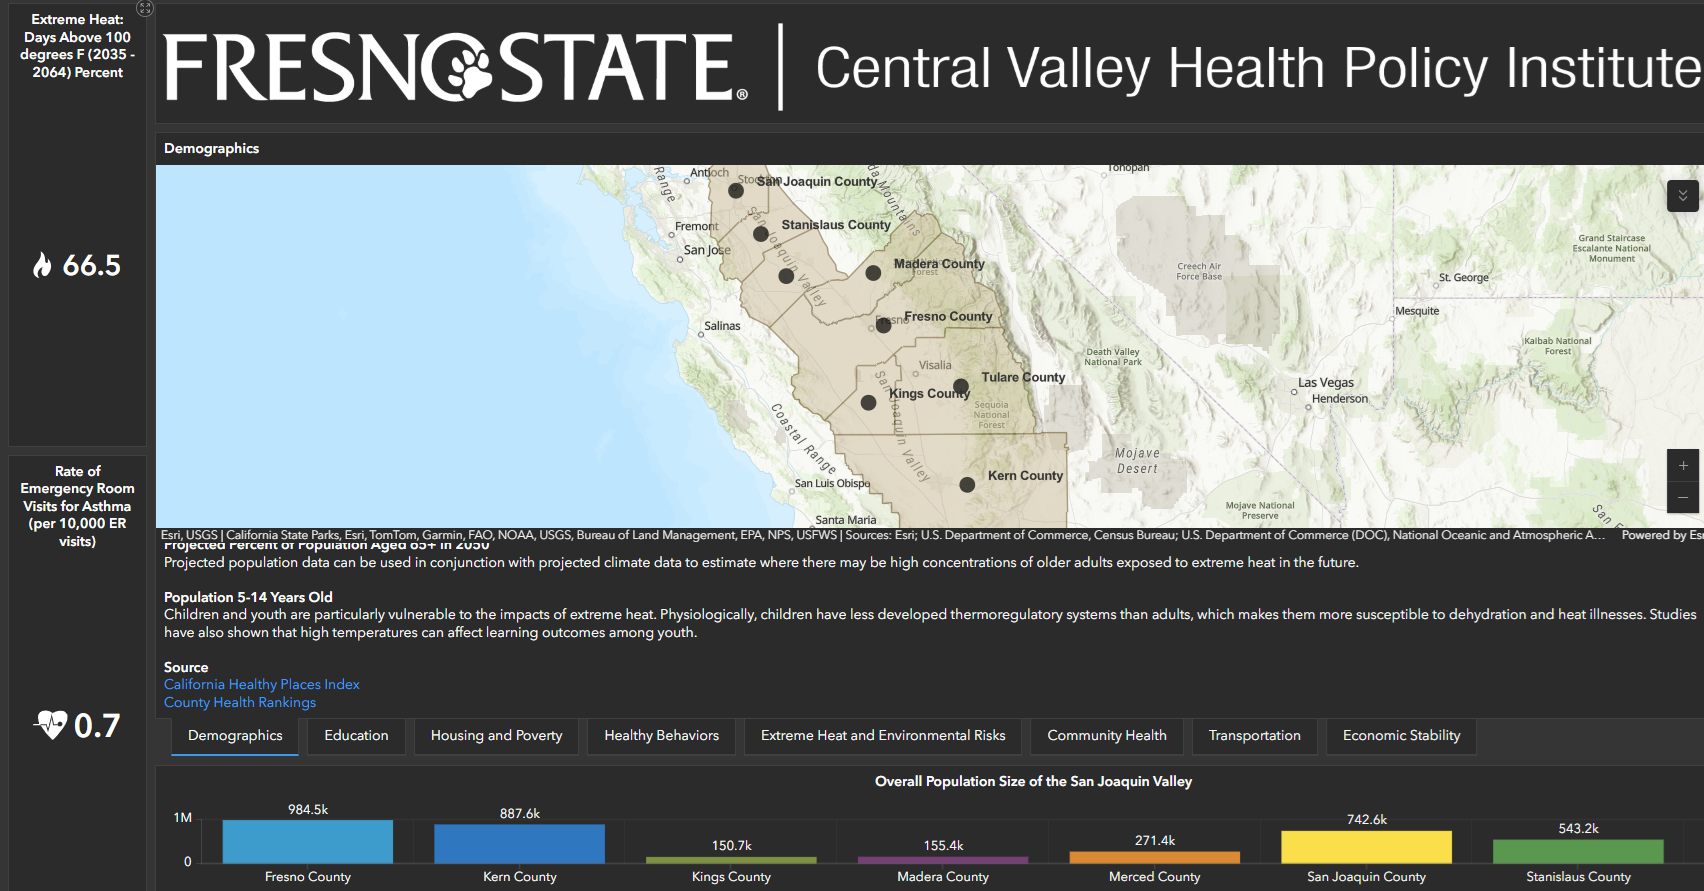
Climate and Health Indicators Data Dashboard
Central Valley Health Policy Institute performed a secondary research analysis on the climate and health impacts of the San Joaquin Valley. The effects of excess heat have been shown to rise across the region, state, and national levels. As a result, excess heat and other climate indicators have been linked to increased health risks for residents in the San Joaquin Valley and the state of California. The data dashboard was created to show the numerous health impacts, projections of the result of environmental burdens, and the lasting adverse health impacts it can have on the San Joaquin Valley residents who already reside in disproportionately impacted neighborhoods. These most vulnerable populations continue to have their health exacerbated because of the chronic health conditions due to adverse climate impacts.
The interactive dashboard includes a series of maps showing the climate and health indicators along with demographics and economic indicators. Each map contains data points reflecting each respective county. There are eight counties in the San Joaquin Valley: Fresno, Kern, Kings, Madera, Merced, San Joaquin, Stanislaus, and Tulare. The descriptions within the maps outline the disparities in the most vulnerable census tracts. In the data interactive maps, there are links to the secondary research data sources that are publicly available. The left panel of the map displays the average extreme heat days and the average emergency department admissions rate for asthma in the San Joaquin Valley. The right panel contains the entire dataset, which shows the comparisons of the eight counties, San Joaquin Valley, and California's baseline averages.
COVID-19 Equity Project
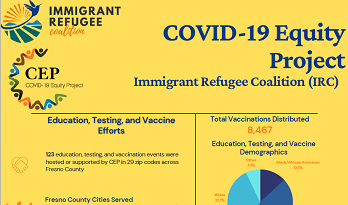
The COVID-19 Equity Project (CEP) is a collaborative effort between various community-based organizations all over Fresno County. The goal of CEP is to ensure that Fresno County populations are provided with support to alleviate disparities perpetuated by the COVID-19 pandemic.
Below are the infographics CVHPI staff have developed to bring information to communities all across communities in Fresno County. Please click on the title below each thumbnail to access each infographic.
-
COVID-19 Vaccines Update: Additional Dose & Booster Shot
Actualización de las vacunas COVID-19: dosis adicional y vacuna de refuerzo
October 2021
Updated: November 23, 2021 -
Understanding COVID-19 Vaccines
October 2021
Unequal Neighborhoods: Merced
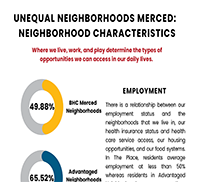
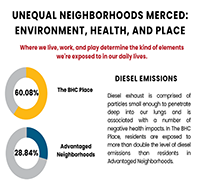
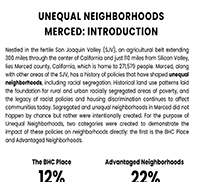
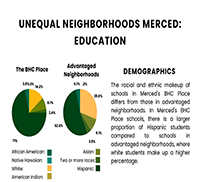
Nestled in the fertile San Joaquin Valley (SJV), an agricultural belt extending 300 miles through the center of California and just 110 miles from Silicon Valley, lies Merced County, California, which is home to 271,579 people. Merced, along with other areas of the SJV, has a history of policies that have shaped unequal neighborhoods, including racial segregation. Historical land use patterns laid the foundation for rural and urban racially segregated areas of poverty, and the legacy of racist policies and housing discrimination continues to affect communities today.
Although the historical policies and codes that helped create inequality were put in place decades ago, policies based on race/ethnicity, social class, and other forms of systematic discrimination have had a large impact on what neighborhoods in Merced look like today.
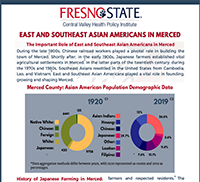
Please click on the title below each thumbnail to access each full-length infographic. To learn more about the project, please visit the Unequal Neighborhoods webpage.
-
2024
-
2024
Unequal Neighborhoods: Fresno
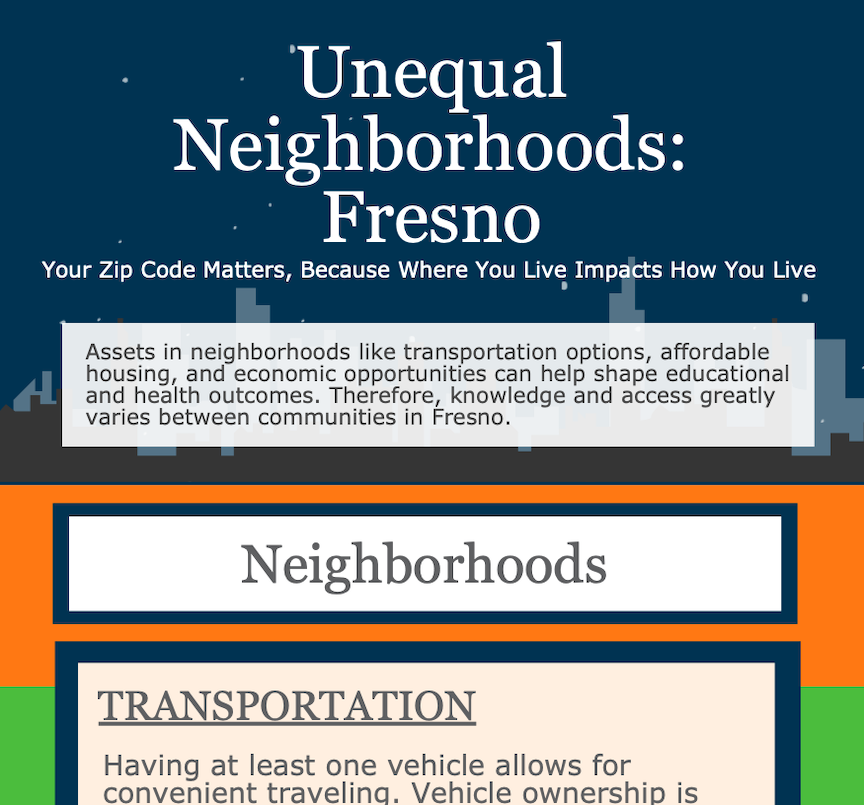
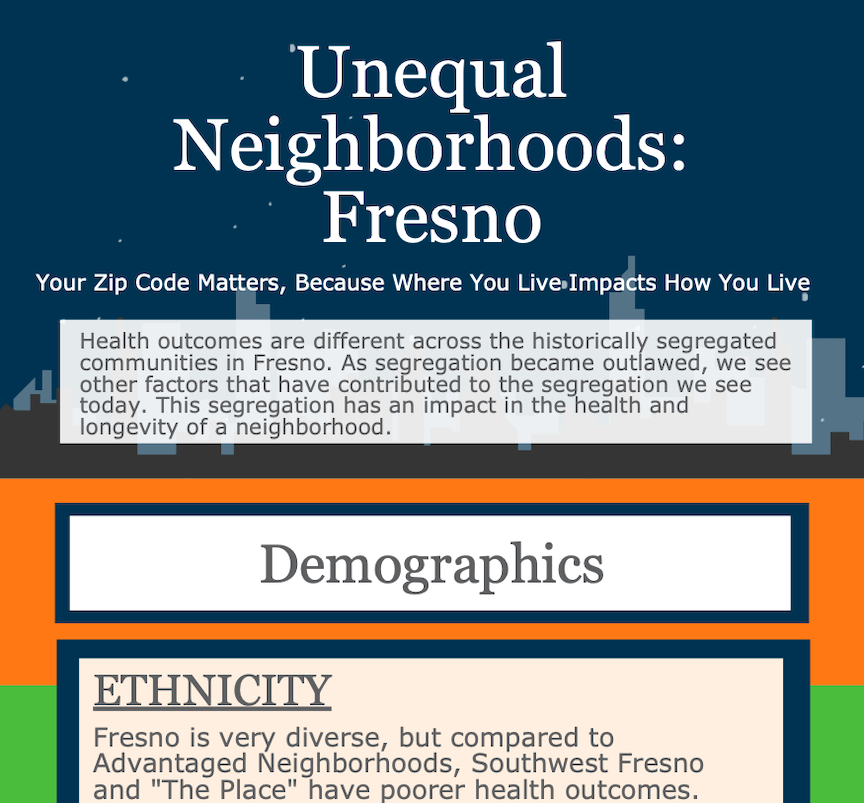
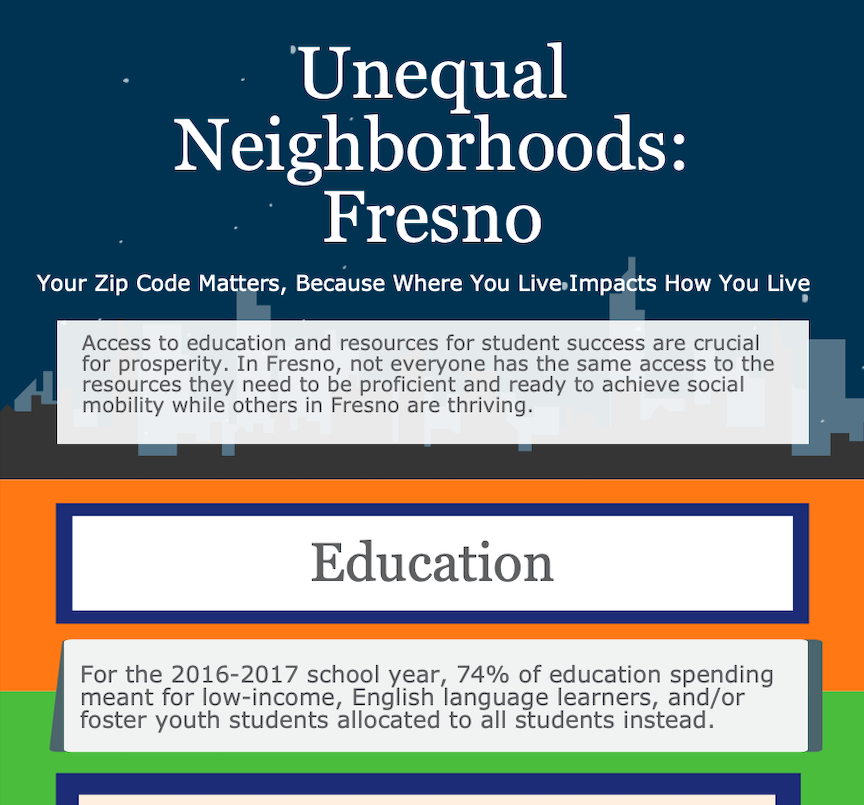
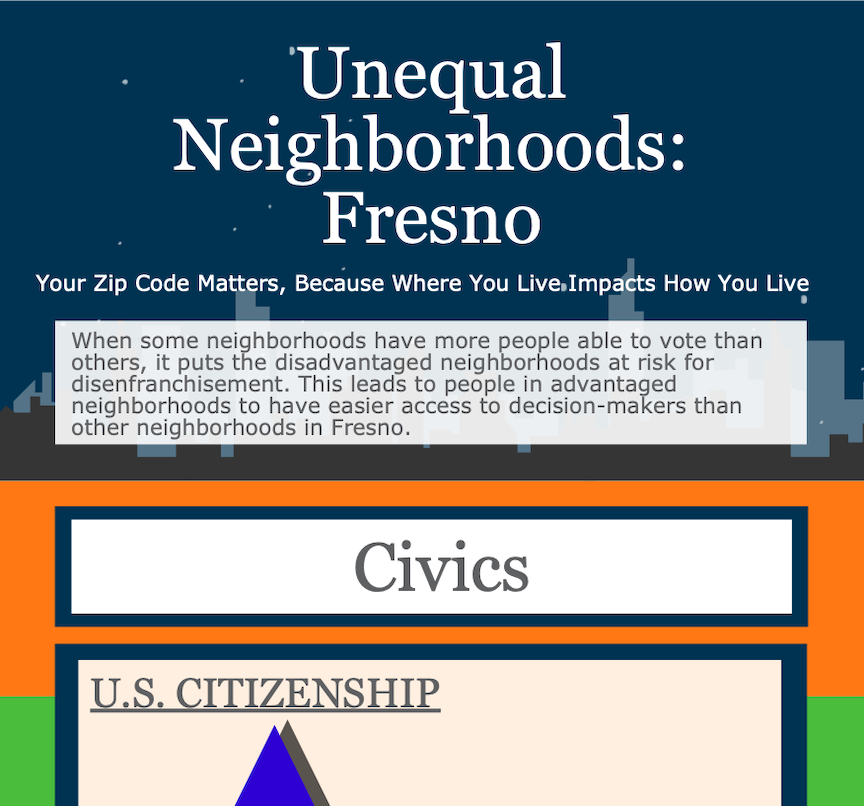
The well known plagues of Fresno, such as low air quality, little green space, poor health, low education, and poverty, did not surface spontaneously. Decades of policies and neglect have created these conditions, but not for all. While some neighborhoods experienced neglect, other neighborhoods had opportunities created for them through forward-thinking vision and policies, furthering the gap between the poor and upper middle class in Fresno.
The concept of Unequal Neighborhoods is a framework that sees Fresno beyond one data point. Rather, Fresno is a sum of consequences of policies and exceptions to policies that shaped the city to have some neighborhoods sharing outcomes with some of the best places to live in California and others that are among the most dangerous, unhealthy, and polluted.
Please click on the title below each thumbnail to access each full-length infographic. To learn more about the project, please visit the Unequal Neighborhoods webpage.
-
Neighborhoods
2018 -
Demographics
2018 -
Education
2018 -
Civics
2018
Data by Year
San Joaquin Valley Climate Change Infographic
2020
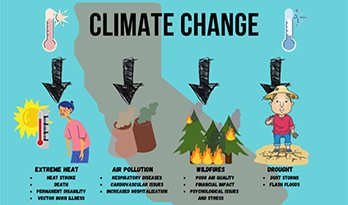
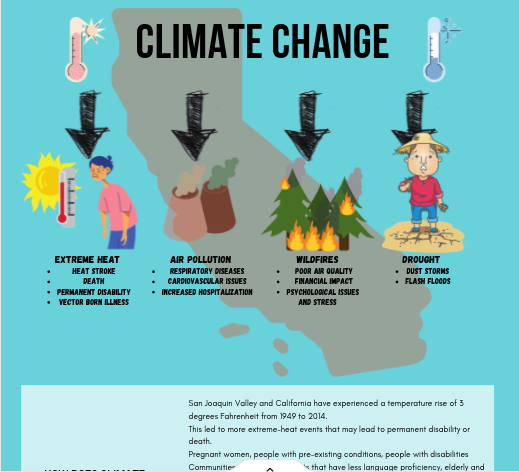
San Joaquin Valley and California have experienced a temperature rise of 3 degrees Fahrenheit from 1949 to 2014. This led to more extreme-heat events that may lead to permanent disability or death.
Oral Health One-Pager: Lessons Learned from Evidence-Based Research to Strategic Communication
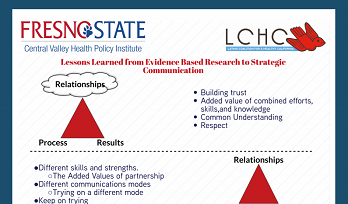
May 2018Oral health discourse has gained strength in the media and advocacy space recently resulting in a multitude of messages. The Central Valley Health Policy Institute and the Latino Health Coalition (LCHC) partnered to analyze oral health access issues and collaboratively crafted a series of strategic messages. This one-pager “Lessons Learned from Evidence Based Research to Strategic Communication” lays out how this partnership was fostered and shares examples of communication pieces for four audiences: the public, advocates, providers and decision-makers.
Obstacles to Food Access in The Place
August 2017In The Place, there are challenges to accessing healthy food options. Residents have difficulty securing affordable and nutritious foods for themselves and their families.
Health Disparities in "The Place"
August 2017Our health is influenced by a combination of access to healthy options, genetics, and personal choices.
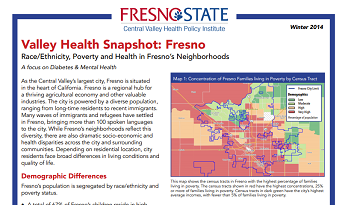
Valley Health Snapshot: Fresno Race/Ethnicity, Poverty and Health in Fresno’s Neighborhoods
Winter 2014As the Central Valley’s largest city, Fresno is situated in the heart of California. Fresno is a regional hub for a thriving agricultural economy and other valuable industries. The city is powered by a diverse population, ranging from long-time residents to recent immigrants. Many waves of immigrants and refugees have settled in Fresno, bringing more than 100 spoken languages to the city.
While Fresno’s neighborhoods reflect this diversity, there are also dramatic socio-economic and health disparities across the city and surrounding communities. Depending on residential location, city residents face broad differences in living conditions and quality of life.
-
