Dentistry During and After the COVID-19 Pandemic: A Dental Providers’ Perspective
Prepared by
Hayam Megally, MPH, CHES, CPH
John Capitman, PhD
Marlene Bengiamin, PhD
https://www.fresnostate.edu/chhs/cvhpi/
Dentistry During and After the Covid-19 Pandemic: A Dental Providers’ Perspective
Introduction
Dentistry has been one of the health sectors hardest hit by the COVID-19 pandemic. With the rise in number of cases in many areas in the country, the American Dental Association in mid-March recommended dentists nationwide to postpone all elective dental procedures for the following three weeks, to alleviate the burden that dental emergencies would place on hospital emergency departments and to conserve essential personal protective equipment (PPE) for the frontline health care workers. In addition, due to the generated aerosols during most dental procedure and the proximity of individuals during those procedures, dental team and patients are at high risk of virus transmission. With the evolving nature of this crisis, the ADA extended this recommendation to April 30th at the earliest. While those recommendations were appropriate for states that experienced accelerating COVID-19 infection rates, some other states, where infection rates were declining, were in need for different guidance. Some dentists preferred to close their practice temporarily, while others kept their door opened to see only emergency and urgent cases. As of May 18th, 42 states have allowed dentists to re-open their practices and resume providing elective dental procedures.
On March 27th president Trump signed into law the Coronavirus Aid, Relief and Economic Security Act, also known as the CARES Act, which enabled dental providers, as small businesses owners, to apply for the Paycheck Protection Program loan and the Economic Injury Disaster Loan. This financial support was needed for many dentists to maintain their practices and protect themselves and their employees during this unprecedented economic disturbance due to COVID-19.
As many dental providers and their staff prepare to re-open their practices, it is essential to understand their perspective on how the COVID-19 pandemic may have a long term impact on their practices and on dentistry in general. Patients will certainly be affected by this impact. There is a need to understand the policies that dental providers would support that aim to ensure patients would be able to receive safe and affordable dental care after the COVID-19 pandemic. This report presents findings of a survey that the Central Valley Health Policy Institute sent to dental providers nationwide. As a timely response to the pandemic, this work aims to understand the dental providers’ perspective on how dentistry is and will be impacted by the COVID-19 pandemic and to know their suggested policy recommendations to support the dental community.
Methods
The Central Valley Health Policy Institute created a survey and shared it with many contacts nationwide. Using a snowballing sampling method, dental providers were encouraged to respond to the survey and to forward it to their fellow dental providers. Non dental providers were requested to share it with every dental provider in their contacts. The survey was shared on April 30th 2020 and was closed on May 13th 2020. The survey included questions about the respondents’ dental setting they work at and its state location, their perception about the CDC interim infection control guidance in its effectiveness in preventing virus transmission to the dental team and the patients, the informational and financial support they received during the pandemic, their perception about the future of their businesses when they re-open their dental practices, and the policies they would support to address their anticipated challenges amid COVID-19. Most questions were closed-ended while few were open-ended. The survey yielded to 92 responses from 47 states. Figure 1 shows the states that represent all respondents. As shown dental providers whose practices are located in California made 34% of total responses. According to the dental setting the respondent work at, the majority of them works in Federally Qualified Health Center (58%) and 16% works in a standalone private dental practice, 5% at a dental corporation, and 5% at a mobile dental clinic.


Locations labeled on the chart: California, Virginia, Texas, Montana, Washington, Colorado, Nebraska, New York, Ohio, Oregon, Pennsylvania, Connecticut, New Mexico, North Carolina, Alaska, Arizona, Hawaii, Idaho, Illinois, Iowa, Kentucky, Indiana, Massachusetts, Michigan, Missouri, New Jersey, Rhode Island, and West Virginia. California has the largest share, approximately 34%.
Fourteen percent of respondents identified their dental setting as either community dental clinic, public health setting, or dental school. Three respondents identified themselves as Registered Dental Hygienist in Alternative Practice, a midlevel dental provider authorized to practice in CA, as their practice setting.
Findings
Effectiveness of the CDC interim infection control and prevention guidance.
As shown in figure 2, thirty-six percent of respondents perceived the CDC interim infection control and prevention guidance as extremely and very effective in preventing virus transmission to dental team, while 46% believed that the guidance is moderately effective. Sixteen percent believed that it is slightly effective and only 2% thought it is not effective at all. On the other hand, 38% of respondents believed the guidance is extremely and very effective to prevent virus transmission to their patients and 43% thought it is moderately effective. Fourteen percent of respondents thought it is slightly effective and 6% thought that it is not effective at all in preventing virus transmission to their patients, as shown in figure 3. There was a strong correlation between the perceptions about the effectiveness of the guidance to prevent infection to the dental team with that to their patients. The more likely respondents believed it is effective to prevent infection to the dental team the more likely they believed it is effective for their patients as well and vice versa.
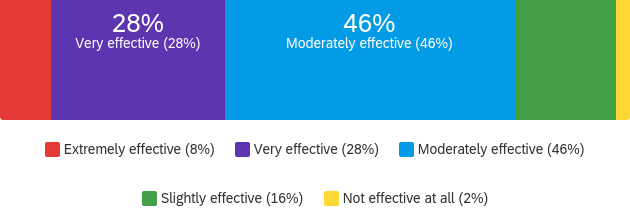
| Perceived effectiveness | Respondents |
|---|---|
| Extremely effective | 8% |
| Very effective | 28% |
| Moderately effective | 46% |
| Slightly effective | 16% |
| Not effective at all | 2% |
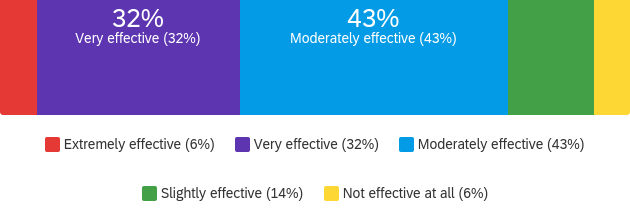
| Perceived effectiveness | Respondents |
|---|---|
| Extremely effective | 6% |
| Very effective | 32% |
| Moderately effective | 43% |
| Slightly effective | 14% |
| Not effective at all | 6% |
Support Dental Providers Received during the Pandemic
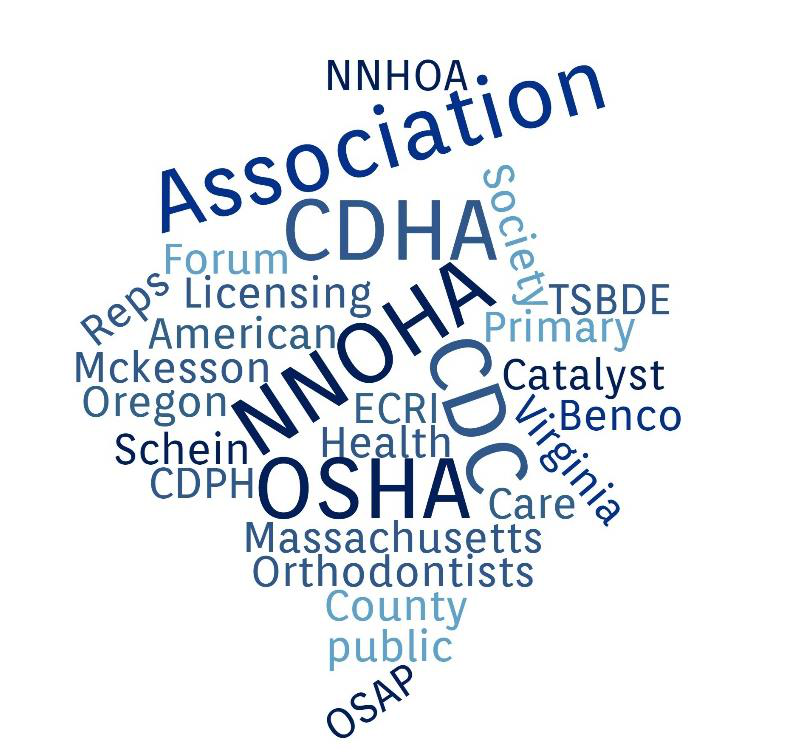
Dental providers received informational, advocacy, and financial support to assist them dealing with the COVID-19 situation. This support was provided through many national and local sources to offer general guidance during the pandemic. In addition, several dental societies offered support that focused mainly on information and advocacy that were more relevant to dental providers. Table 1 shows how the respondent perceived the support offered by their national, state, and local dental societies. In addition, respondents shared some other resources, although some of them are not organized dental groups, they found helpful guidance for dental related issues. Most of them are shown in figure 4.
| Dental Society | Extremely useful | Very useful | Moderately useful | Not at all useful | Total | ||||
|---|---|---|---|---|---|---|---|---|---|
| Percentage | Count | Percentage | Count | Percentage | Count | Percentage | Count | ||
| State Dental Association | 11.36% | 10 | 19.32% | 17 | 50.00% | 44 | 19.32% | 17 | 88 |
| American Dental Association | 15.91% | 14 | 23.86% | 21 | 52.27% | 46 | 7.95% | 7 | 88 |
| Local Dental Association | 7.32% | 6 | 17.07% | 14 | 37.80% | 31 | 37.80% | 31 | 82 |
Dental providers, as small business owners, were eligible to apply for the financial support offered through the CARES Act such as the Economic Injury Disaster Loan (EIDL) Program and Paycheck Protection Program (PPP). Figure 5 shows the percentage of dental providers who applied for those loans and the dental settings they work at. As shown, all respondents that work at dental corporations, 69% of standalone dental practice, 60% of mobile dental clinics, and 51% of FQHCs reported that they applied for the financial support. Twenty-nine percent of respondent who work at FQHCs did not find this question applicable for them. Among those who applied (n=39), the average percentage of respondents who believed that the amount was adequate to their business needs was 62% while 33% believed it was not adequate, and 5% perceived the amount as neither adequate nor inadequate for them. This perception varied according to the respondents’ dental setting. Out of the 62% who believed the amount was adequate for them (n=28), 54% worked at FQHCs, compared to 17%,13%, and 4% worked at standalone practice, dental corporation, and mobile dental clinics respectively, as shown in figure 6.
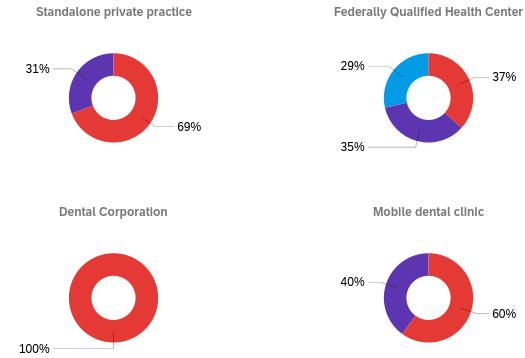
| Dental setting | Yes | No | Not applicable |
|---|---|---|---|
| Standalone private practice | 69% | 31% | Not shown |
| Federally Qualified Health Center | 37% | 35% | 29% |
| Dental Corporation | 100% | Not shown | Not shown |
| Mobile dental clinic | 60% | 40% | Not shown |

| Dental setting | Adequate | Inadequate |
|---|---|---|
| Standalone private practice | 17% | 31% |
| Federally Qualified Health Center | 54% | 31% |
| Dental Corporation | 13% | 8% |
| Mobile dental clinic | 4% | 15% |
The timing of receiving the financial support somehow varied as perceived by the respondents. Thirty-six percent received the loans on time and same percentage received them early, while 15% received their financial support late. Thirteen percent of respondents (n=5) shared that they have not received the loans yet. The time period of collecting survey responses was from April 30th to May 13th. Figure 8 shows the respondents perception about the timing of receiving the loans and the date of recording their responses.
| Timing | Respondents |
|---|---|
| On time | 36% |
| Early | 36% |
| Late | 15% |
| Did not receive it yet | 13% |
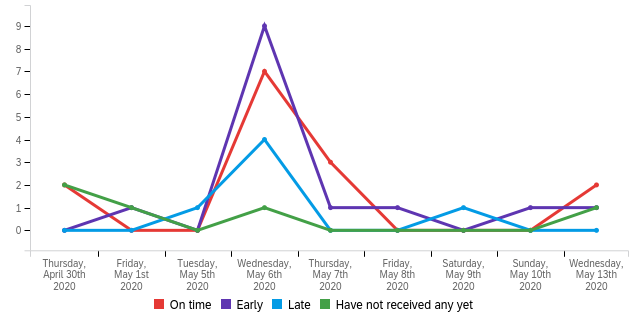
Figure 8 displays respondents’ reports by survey response date from Thursday, April 30th 2020 through Wednesday, May 13th 2020. Categories shown are On time, Early, Late, and Have not received any yet.
| Date in 2020 | On time | Early | Late | Have not received any yet |
|---|---|---|---|---|
| Thursday, April 30 | 2 | 0 | 0 | 2 |
| Friday, May 1 | 0 | 1 | 0 | 1 |
| Tuesday, May 5 | 0 | 0 | 1 | 0 |
| Wednesday, May 6 | 7 | 9 | 4 | 1 |
| Thursday, May 7 | 3 | 1 | 0 | 0 |
| Friday, May 8 | 0 | 1 | 0 | 0 |
| Saturday, May 9 | 0 | 0 | 1 | 0 |
| Sunday, May 10 | 0 | 1 | 0 | 0 |
| Wednesday, May 13 | 2 | 1 | 0 | 1 |
Despite the previously mentioned support that respondents have received, they lacked some other support. Legal advice was needed and not provided for 30% of our respondents while technical assistance for submitting the loans’ application was needed by 19% and was not offered. Six percent of respondents lacked mental health support. Forty-five percent of respondents stated their own support that they needed and have not received. The most pressing need that many respondents have stated was the lack of clear, timely, and effective dental practice guidance. The shortage of Personal Protective Equipment was also a main challenge for dental providers as expressed by many respondents. More specific and thorough infection control and prevention guidance was also seen by many as a support they lacked receiving. This was especially true for the need to have a strategy to mitigate the generated aerosol, caused by many dental procedures, to protect dental team and patients. On the other hand, few respondents mentioned they needed to know how to motivate their staff to return back to work and others needed more support on how to employ Teledentistry.
“More concrete guidance on in office practice settings. What we should be doing?”
“We are the most at risk profession but do not get allotted any N95 from the public health department”
Changes in the dental practices after the COVID-19 pandemic
Respondents shared some extra measures and strategies that they chose to undertake as a response to the pandemic. Many respondents shared that they added some modification to their facility such as: removing all fabrics from waiting room for easier disinfection, adding air purifier, ultraviolet light disinfection lamps, plexiglass to protect their front desk staff, consider air filtration, enclose operatory rooms, use extra oral suction device, and ensure enough stock of PPE. Some other respondents modifications focused on how they would operate their business in the following measures: reduce patients’ volume seen every day, reduce number of staff, ensure staff and patients’ screening, using Teledentistry, and focus more on prevention and patient education. Whereas, some respondents shared that they would wait and observe the pandemic data and decline of cases. Few respondents expressed that they will have to increase their fees due to the increased cost to run a business. Few more respondents were pessimistic about the future of their businesses that led them to consider “looking for alternative careers” as expressed by one respondent or to “Write up a living will,” as shared by another one.
Many of the required measures to ensure safety for the dental team and the patients will cause an increase in the overhead expenses. The average percentage increase in the overhead expenses due to the pandemic was 27% increase. Figure 9 shows the respondents estimate of this increase.
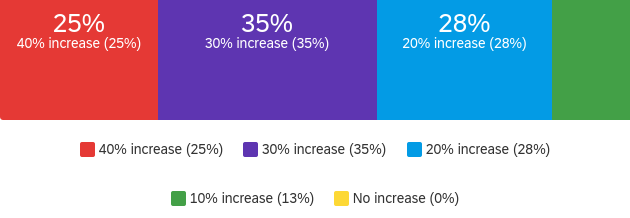
| Estimated overhead expense increase | Respondents |
|---|---|
| 40% increase | 25% |
| 30% increase | 35% |
| 20% increase | 28% |
| 10% increase | 13% |
| No increase | 0% |
The potential increase in the cost of dental care may have an impact on the ability of dental providers to treat patients with different kinds of insurance. Forty percent of respondents were unlikely to keep treating Medicaid (public insurance) patients, compared to only 18% and 11% for patients who pay out of pocket and patients with private dental insurance respectively. Figure 10 shows the percentage of respondents and their likelihood to keep treating patients with different kinds of insurance after the COVID-19 pandemic.
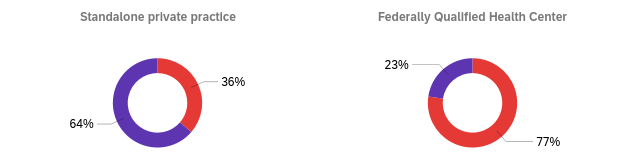
The likelihood of the ability of a dental practice to keep all their staff employed may be impacted by the COVID-19 pandemic. Fifty-six percent of respondents were more likely to keep all their staff employed, compared to 44% that were unlikely to keep all of them employed after the pandemic. This percentage varied according to the respondents’ dental setting, where 77% of the FQHCs were more likely to keep all their staff compared to 60%, 50% and 36% of mobile dental clinics, dental corporation and standalone practice respectively, as shown in figure 11.
| Patient insurance/payment type | Unlikely | Likely |
|---|---|---|
| Patients who pay out of pocket | 18% | 82% |
| Patients with private insurance | 11% | 89% |
| Medicaid patients | 40% | 60% |

| Dental setting | Likely | Unlikely |
|---|---|---|
| Standalone private practice | 36% | 64% |
| Federally Qualified Health Center | 77% | 23% |
| Dental Corporation | 50% | 50% |
| Mobile dental clinic | 60% | 40% |
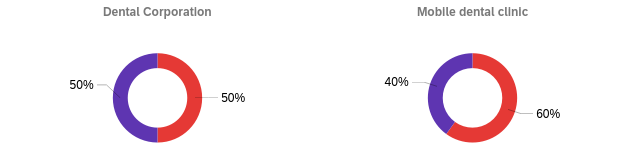
After the pandemic, the willingness of patients to receive regular dental care may be impacted. Seventy-Four percent of the respondents believed that their patients will still be willing to receive regular dental care after the pandemic. This was especially true for providers who work at FQHCs where 86% of them had the same believe. Sixty percent of dental providers at mobile dental clinics and 50% of providers who work at standalone practice and at dental corporation believed that their patients will still be willing to receive regular care after pandemic, as shown in figure 12.
Policies to support
Most respondents supported the idea of the need to increase the reimbursement rates for most covered services by all dental insurances (73%). The need for dental insurance to reimburse for the infection control and prevention measures was supported by 63% of respondents and to reimburse for the Teledentistry code was supported by 59% of respondents. The need for dental supply companies to offer some discounted prices for their supply to dental providers who serve the public insurance patients was supported by 53%. Some respondents added their own suggestions for policies and considerations that can support the dental community such as, the need to focus more on the preventive dentistry, the need to prioritize dental providers in the provision of PPE, and to increase the reimbursement for Teledentistry,

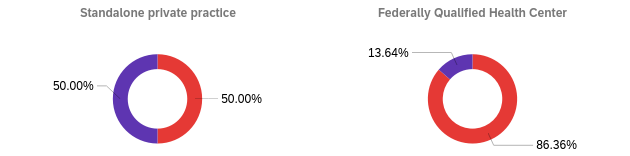
| Dental setting | Likely | Unlikely |
|---|---|---|
| Standalone private practice | 50.00% | 50.00% |
| Federally Qualified Health Center | 86.36% | 13.64% |
| Dental Corporation | 50.00% | 50.00% |
| Mobile dental clinic | 60.00% | 40.00% |
Discussion
This report presents findings of a survey sent to dental providers nationwide to help understand the challenges that the COVID-19 pandemic has posed on them. As a timely response to this unprecedented situation, this report aims to convey the dental providers’ perspective to inform equitable policy and system adjustments.
The CARES Act has provided some financial support that was needed especially when dental providers were mandated to only treat emergency and urgent cases, while some of them have temporarily closed their practices. The results of this survey shows that this financial support was seen adequate by many respondents while not adequate for some according to their business needs. Almost half of this survey respondents were dental providers that work at FQHCs. The over-representation of this group may explain its higher percentage of providers who perceived the financial support adequate to their business needs from this group compared to all other groups. Few respondents were not sure about the adequacy of the amount compared to their needs which reflect the uncertainty and vagueness of their future financial needs and this whole situation.
The organized dental societies can offer a lot of assistance in those situations of uncertainty and vagueness. The nature of this pandemic that varies for each county pose an additional and essential role on the local dental societies to provide support for their local providers. However, the local dental associations and societies were not seen highly useful as perceived by most respondents. The needed support could have been provided through, and not limited to, providing current, timely, and accurate information and guidance about the status of the pandemic, be the hub for providers to communicate, and to ensure adequate and affordable supply of PPE especially for private practices through approaching local supply providers about buying in bulk to reduce the expenses for their members.
The lack of concrete and timely guidance that could have assist the dental providers through their re-opening phase, forced them to implement their own measures as they see suiting their practices. For some settings those measures were extreme and very costly and for some others were minimal. Whereas, some preferred to not take any measures and were observing the evolving situation.
The infection control and prevention guidance during the pandemic will pose additional overhead expenses on dental providers. The additional cost may lead to increase in the fees for many dental services. Not many patients will afford this increase. The patients who will be hit the hardest are the ones who are already experiencing disparity in accessing dental care such as communities of color, older adults, patients with special health needs, and patients who rely on public insurance. Equitable policy considerations should be implemented to avoid widening the gap that already exists in accessing the care and the oral health outcomes. There is a need for advocacy efforts that support the dental community and protect the patients’ rights to receive safe and affordable dental care.
Conclusion
This report presents findings of an e-survey sent to dentists to gain more understanding of their perception of how the COVID-19 pandemic has impacted their work. It is most likely that by the time this report is published, many of those findings will be outdated. However, this report will highlight the challenges that many dental providers have experienced during this pandemic. This work can guide and inform efforts that may be needed to face any future waves of the pandemic or other related emergencies.