Fresno County Community Climate Change Survey

Emanuel Alcala, PHD; Dustin Hedrick, B.A.; Armando Ramirez, B.A.; Josian Zuniga, B.S.
Fresno State Central Valley Health Policy Institute
20
Background
The effects of climate change have been shown to negatively impact San Joaquin Valley residents (Ganesh & Smith 2018). Agricultural labor productivity, migration, and housing are all pressing socio economic issues within the San Joaquin Valley that are also affected by climate change and are, inevitably, focal points within the local legislature. Thus, it is important to understand the overall knowledge, beliefs, and opinions on climate change in Fresno County to inform policymakers. To our knowledge, there has not been a survey study of this scale performed in the Central Valley. Our objectives are twofold:
- Identify relationships between the opinions and knowledge of Fresno County residents toward climate change according to their age, gender, race ethnicity, and place of residence.
- Highlight themes derived from statistical analysis to inform policymakers and community program directors.
Methods
Data was collected from a community-wide survey distributed in a cross-sectional study design. The survey utilized Likert-Type scales to quantitatively measure collected ordinal data. The survey was distributed to Fresno County residents using snowball and convenience sampling methods. SPSS software analyzed statistically significant trends among participant responses via one-way ANOVA test. Avenue for distribution of surveys included fliers, qr code and anonymous link.
Flyer distributed to Fresno County residents for their opinions and ideas on climate change
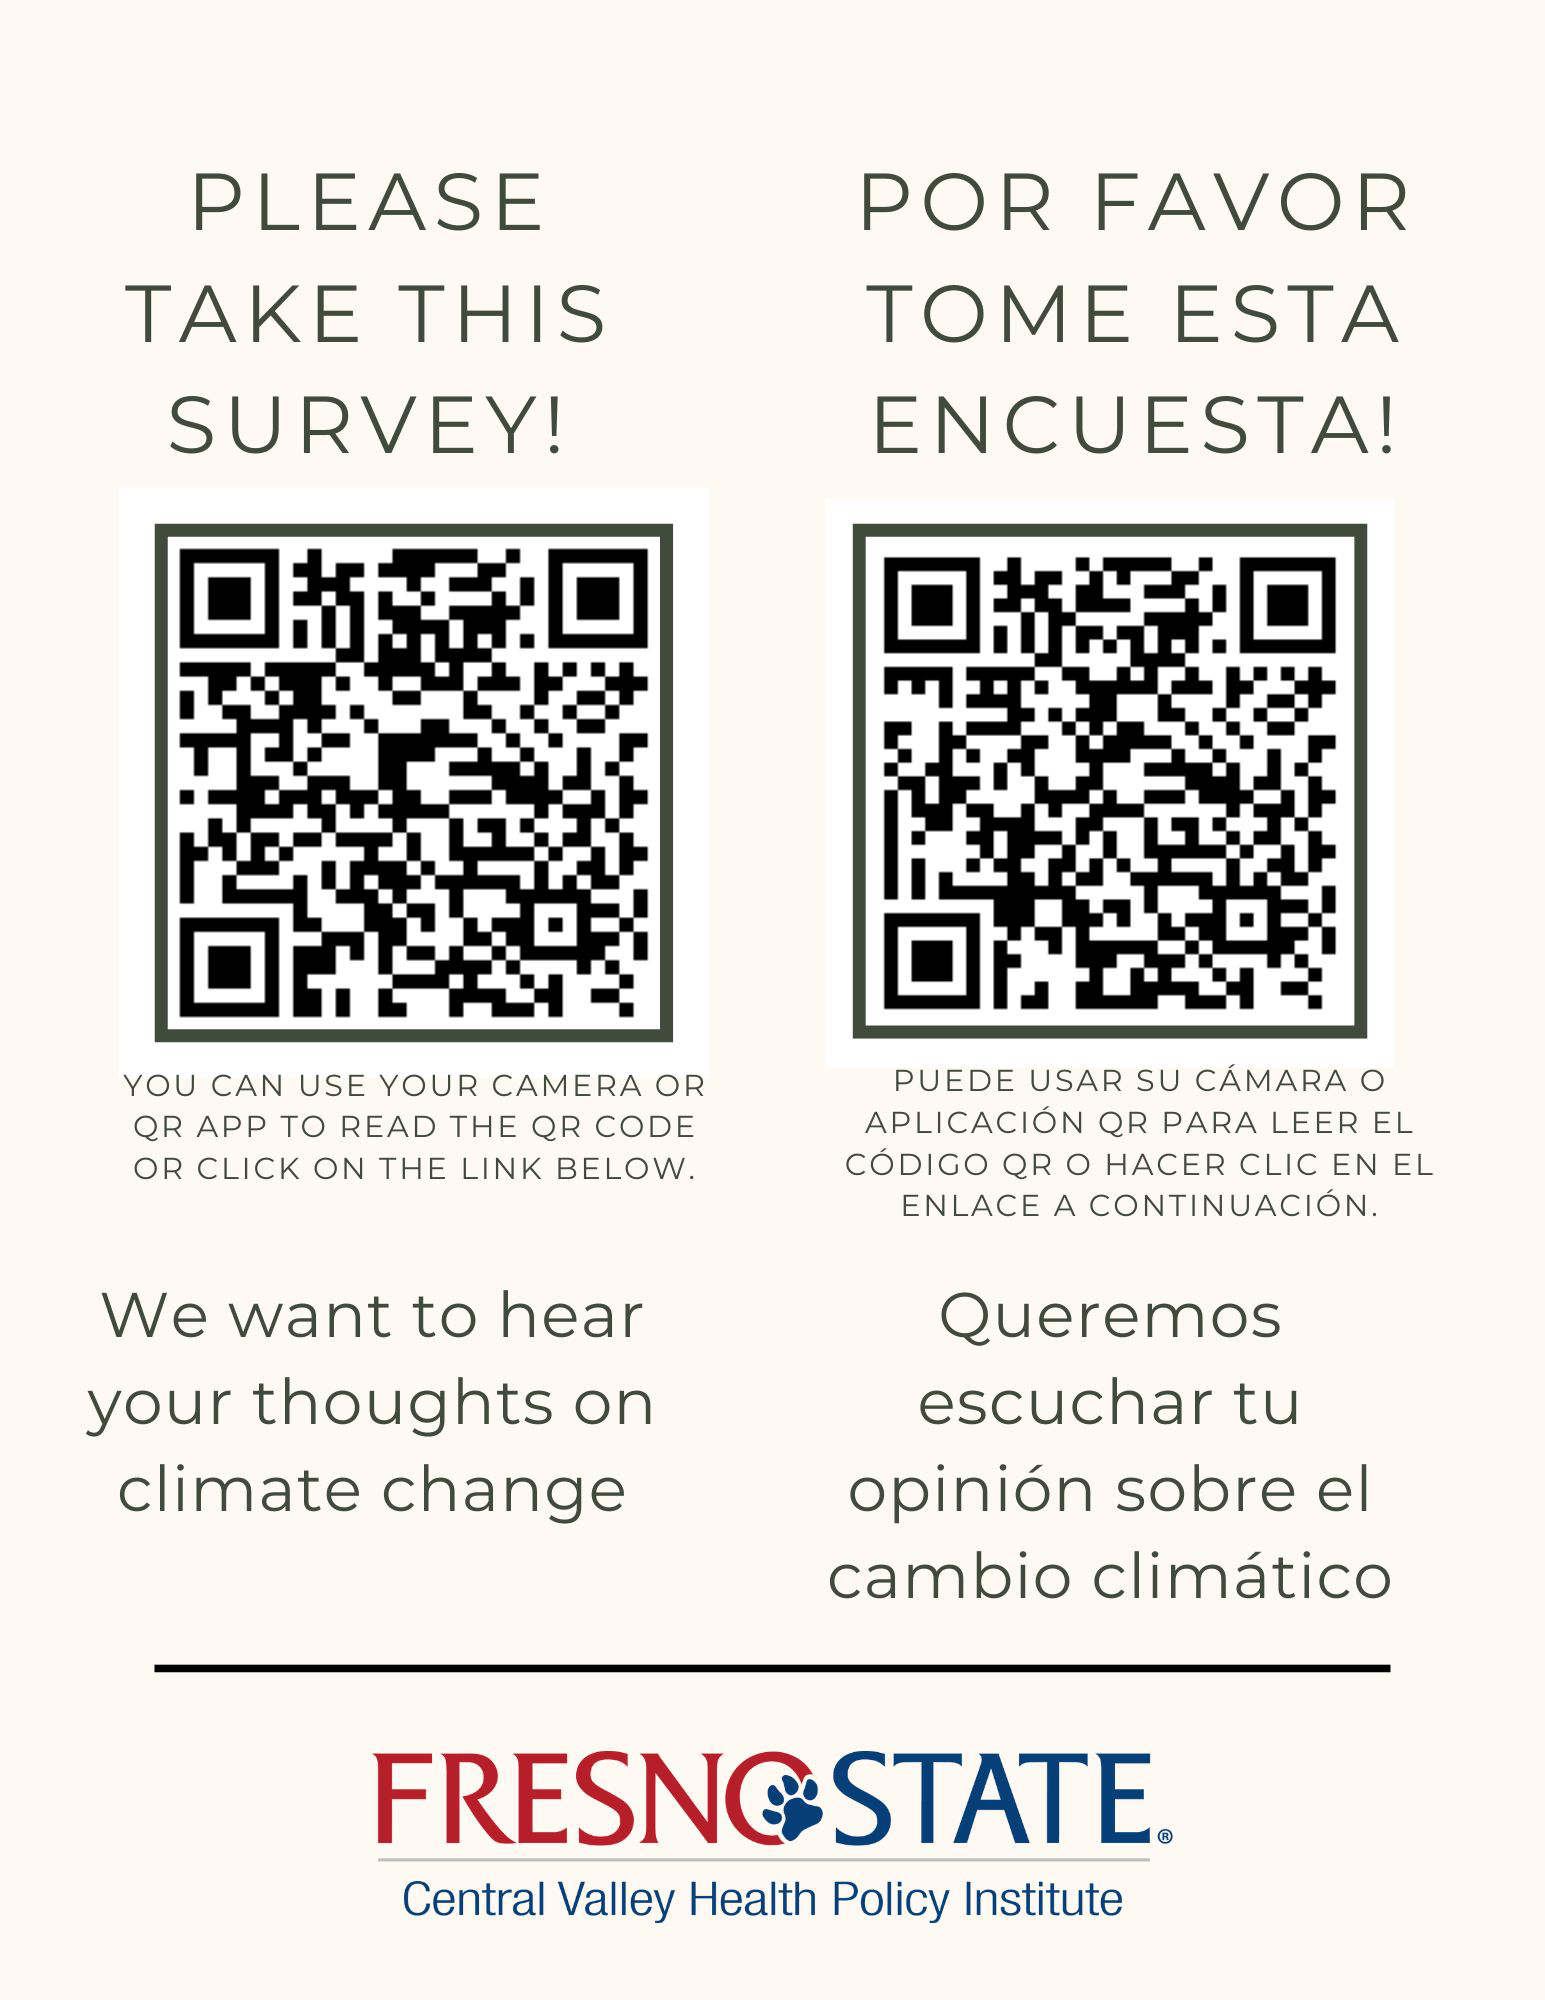
PLEASE TAKE THIS SURVEY!
YOU CAN USE YOUR CAMERA OR QR APP TO READ THE QR CODE OR CLICK ON THE LINK BELOW.
We want to hear your thoughts on climate change
POR FAVOR TOME ESTA ENCUESTA!
PUEDE USAR SU CÁMARA O APLICACIÓN QR PARA LEER EL CÓDIGO QR O HACER CLIC EN EL ENLACE A CONTINUACIÓN.
Queremos escuchar tu opinión sobre el cambio climático
Results
Demographic Characteristics
Figures 1 and 3 do not print individual bar values. Their frequencies below are approximate readings from the charts; the percentages and scores in the other figures are reproduced as printed.
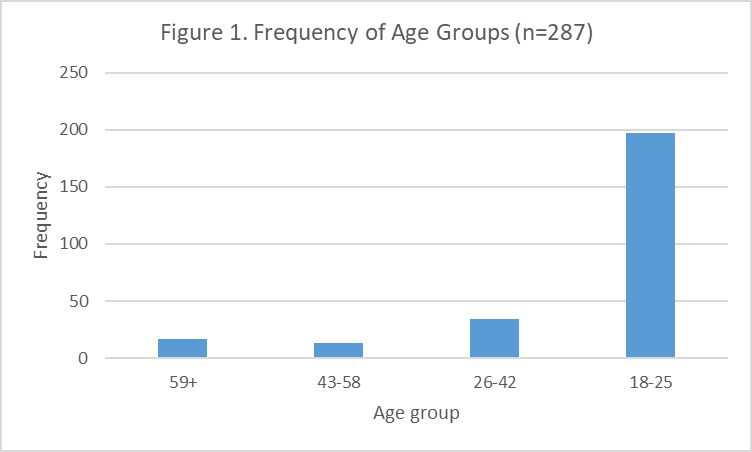
| Age group | Approximate frequency |
|---|---|
| 59+ | Approximately 17 |
| 43-58 | Approximately 13 |
| 26-42 | Approximately 34 |
| 18-25 | Approximately 197 |
Frequency axis: 0 to 250, in increments of 50.
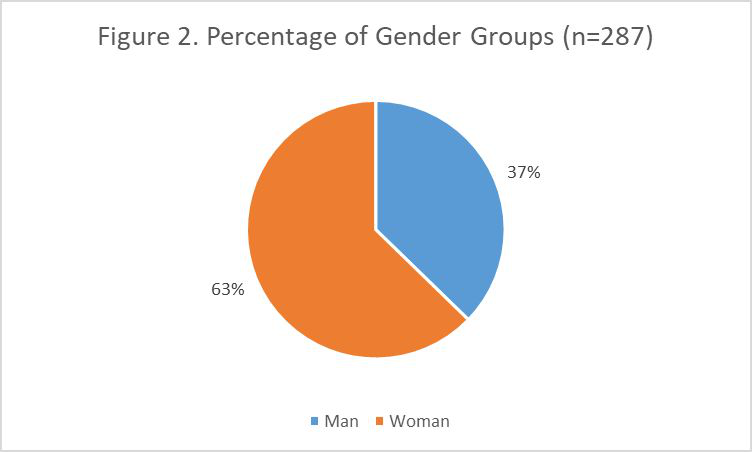
| Gender | Percentage |
|---|---|
| Man | 37% |
| Woman | 63% |
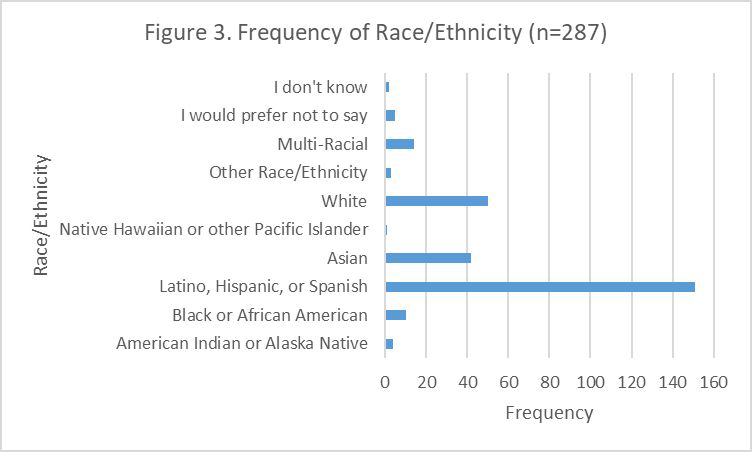
| Race/Ethnicity | Approximate frequency |
|---|---|
| I don't know | Approximately 2 |
| I would prefer not to say | Approximately 5 |
| Multi-Racial | Approximately 14 |
| Other Race/Ethnicity | Approximately 3 |
| White | Approximately 50 |
| Native Hawaiian or other Pacific Islander | Approximately 0 |
| Asian | Approximately 42 |
| Latino, Hispanic or Spanish | Approximately 151 |
| Black or African American | Approximately 10 |
| American Indian or Alaska Native | Approximately 4 |
Frequency axis: 0 to 160, in increments of 20.
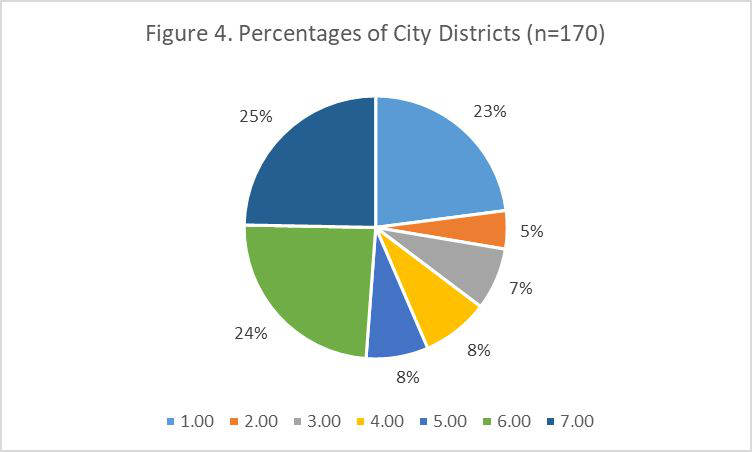
| City district | Percentage |
|---|---|
| 1.00 | 23% |
| 2.00 | 5% |
| 3.00 | 7% |
| 4.00 | 8% |
| 5.00 | 8% |
| 6.00 | 24% |
| 7.00 | 25% |
See Figure 15 for the scoring numbers used for the questions.
Age Groups
The source labels the second age group as 26-42 in Figure 1 and 26-43 in Figures 5-7.
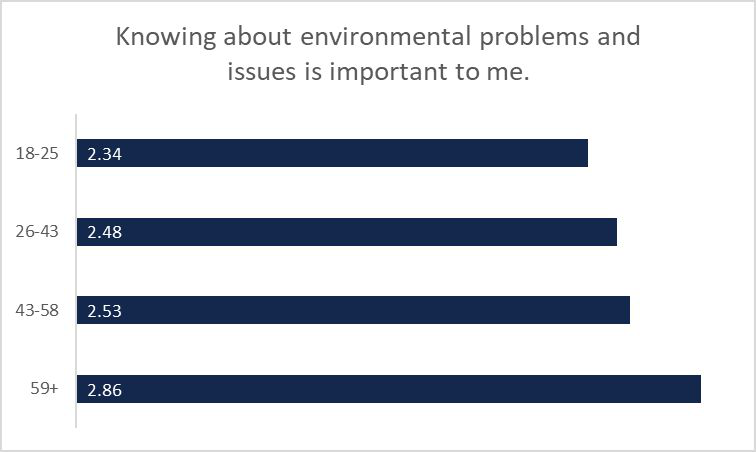
| Age group | Score |
|---|---|
| 18-25 | 2.34 |
| 26-43 | 2.48 |
| 43-58 | 2.53 |
| 59+ | 2.86 |
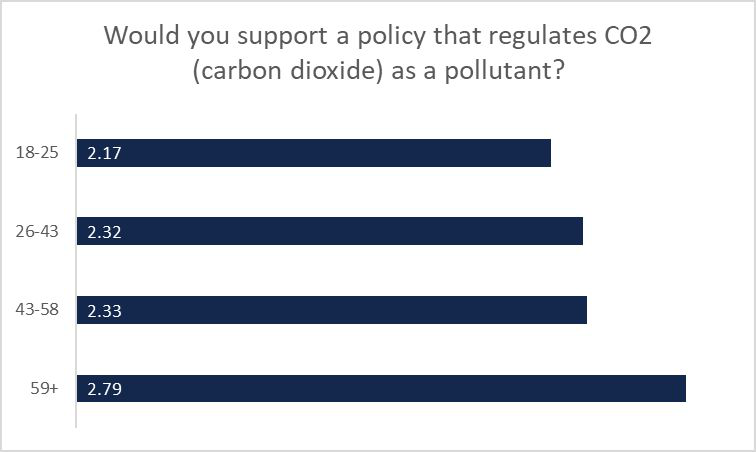
| Age group | Score |
|---|---|
| 18-25 | 2.17 |
| 26-43 | 2.32 |
| 43-58 | 2.33 |
| 59+ | 2.79 |
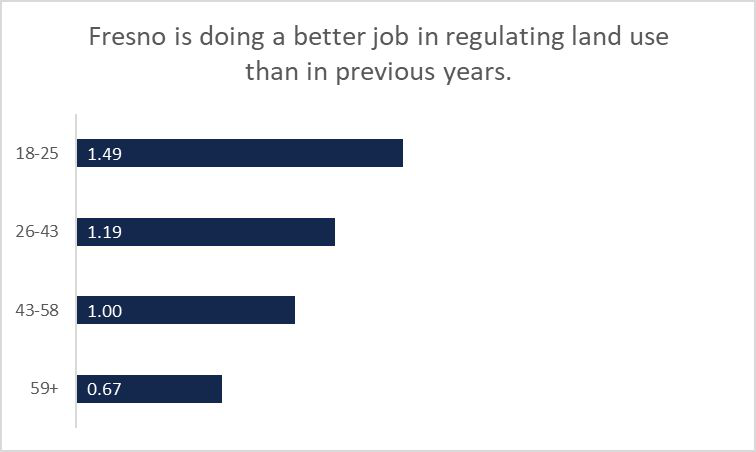
| Age group | Score |
|---|---|
| 18-25 | 1.49 |
| 26-43 | 1.19 |
| 43-58 | 1.00 |
| 59+ | 0.67 |
Gender Groups
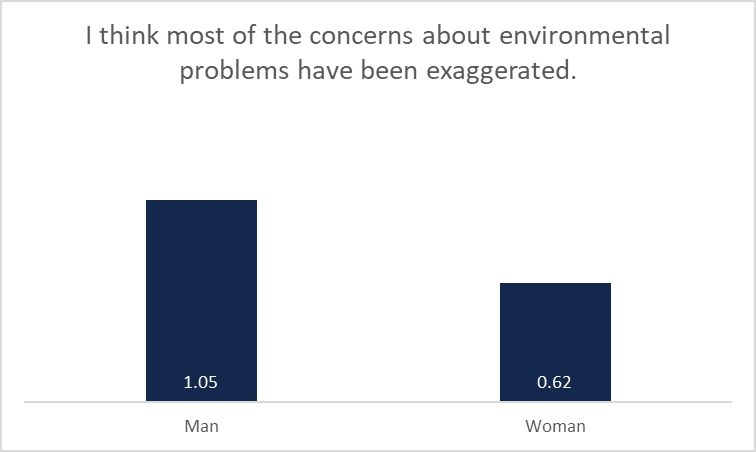
| Gender | Score |
|---|---|
| Man | 1.05 |
| Woman | 0.62 |
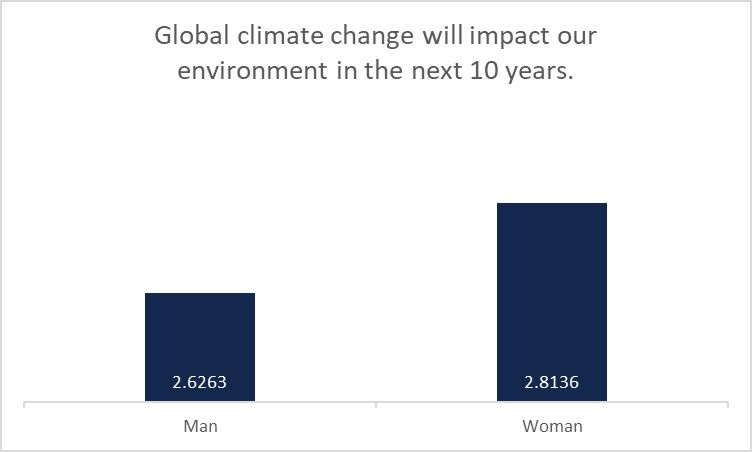
| Gender | Score |
|---|---|
| Man | 2.6263 |
| Woman | 2.8136 |
| Gender | Score |
|---|---|
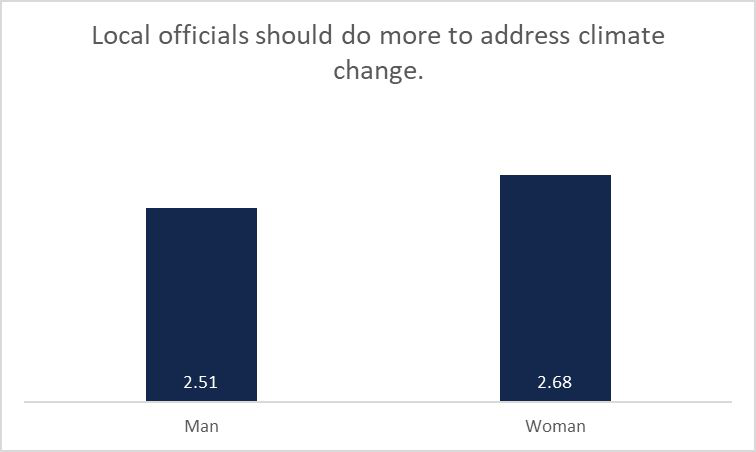
| Man | 2.51 |
| Woman | 2.68 |
Race/Ethnicity Groups
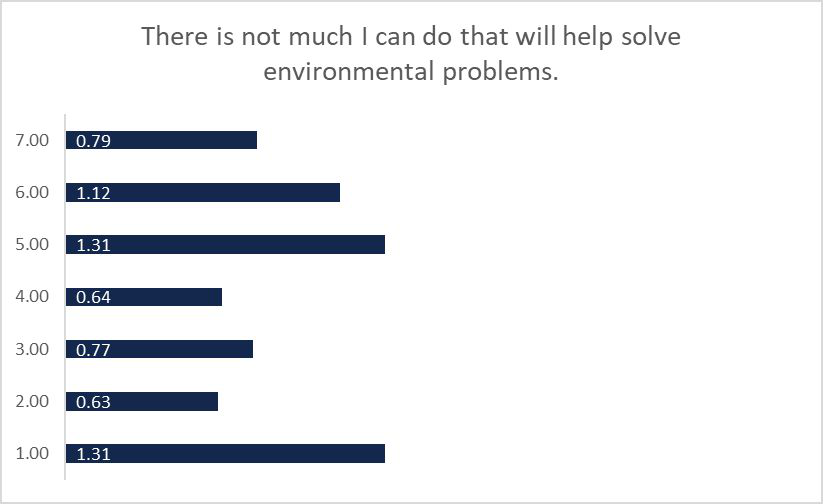
| Race/Ethnicity | Score |
|---|---|
| White | 0.22 |
| Latino | 0.31 |
| Asian | 0.10 |
| African American/Black | 0.32 |
| Other | 1.40 |
| Race/Ethnicity | Score |
|---|---|
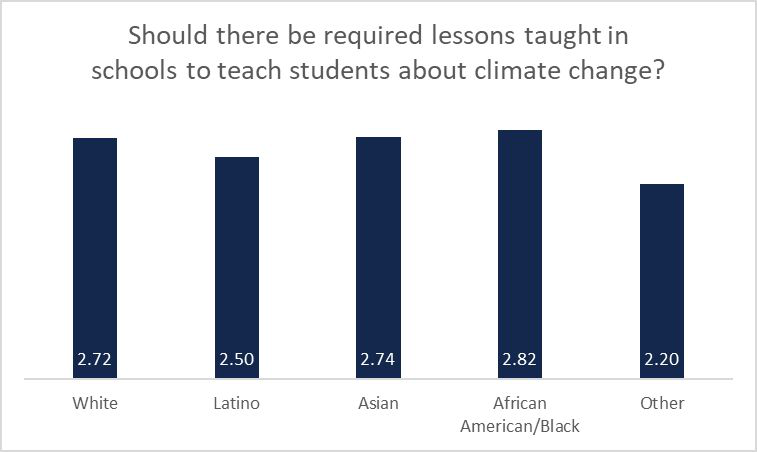
| White | 2.72 |
| Latino | 2.50 |
| Asian | 2.74 |
| African American/Black | 2.82 |
| Other | 2.20 |
| Race/Ethnicity | Score |
|---|---|
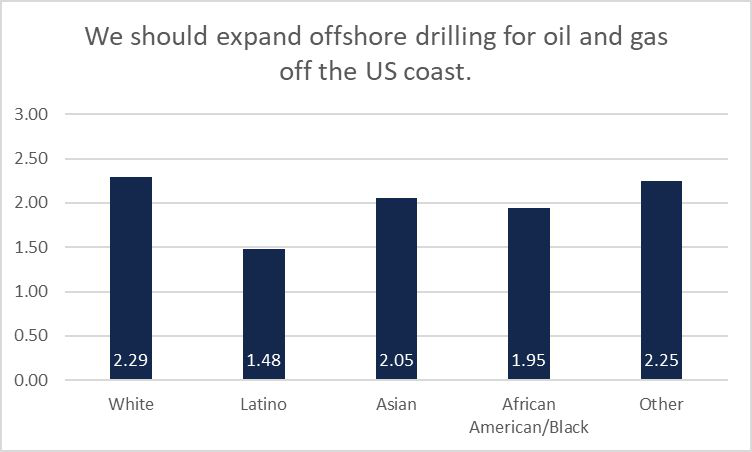
| White | 2.29 |
| Latino | 1.48 |
| Asian | 2.05 |
| African American/Black | 1.95 |
| Other | 2.25 |
Chart scale: 0.00 to 3.00, in increments of 0.50.
City District Groups
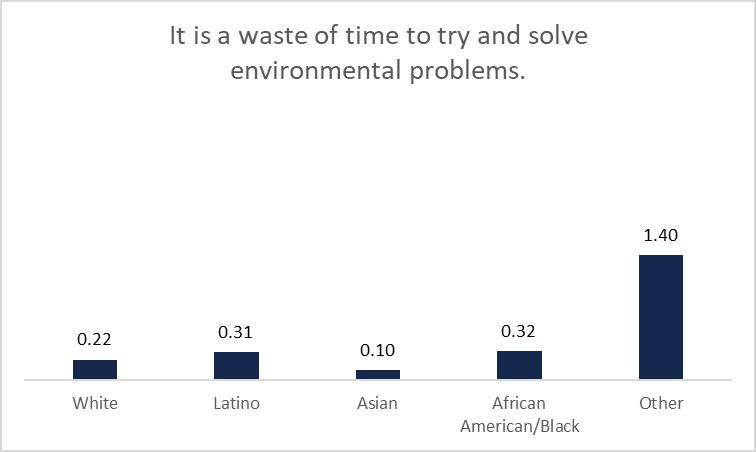
| City district | Score |
|---|---|
| 7.00 | 0.79 |
| 6.00 | 1.12 |
| 5.00 | 1.31 |
| 4.00 | 0.64 |
| 3.00 | 0.77 |
| 2.00 | 0.63 |
| 1.00 | 1.31 |
Scoring numbers for questions
| Score | Response |
|---|---|
| 3 | Strongly Agree |
| 2 | Somewhat Agree |
| 1 | Somewhat Disagree |
| 0 | Strongly Disagree |
Discussion
Age
The age group 59+ was more willing to learn about environmental problems and issues, support more progressive environmental policies. They also show the lowest levels of confidence that Fresno is doing better regulating land use than in prior years. It is assumed the 59+ group have a better gauge of how Fresno has handled land use in the past and are more passionate compared to other groups who have less experience with environmental issues. The data shows that environmental issues are important to all age groups in Fresno County despite data from pew research that shows that younger generations are more willing to engage in environmental policy.
Gender
The differences between gender did not have high levels of variance. Men and women strongly disagreed that concerns were exaggerated about environmental problems. Both groups somewhat agree that global climate change will impact the environment in the next 10 years and want to see local officials do more about climate change. In research by Yale University men and women both expressed that climate change is happening but women expressed higher levels of risk perception than men
Race/Ethnicity
All groups strongly disagreed that it would be a waste of time to solve environmental problems. The groups would like to see more lessons of climate change being taught in schools. They showed varying levels of disagreement to expanding offshore drilling with Latinos and African Americans showing the highest levels of disagreements
City District
Each district expressed disagreement that they could not do anything about solving environmental problems.
Limitations
We used a convenience sample so these findings cannot be generalized to the entire population. We think some participants may not understand some of the questions (offshore drilling). Future surveys should include more questions about other demographics characteristics (i.e income, education level, occupation) to measure differences in those groups.
Conclusion
The survey is still receiving submissions from within the Fresno County area. Data will be analyzed again at a later date. It is important to continue data collection to hear from as many residents. Their voices will be instrumental for local officials creating climate change legislation that will protect the people of Fresno County.
Acknowledgements
Thank you to the Kresge foundation for helping to fund the project. The contents are those of the author(s) and do not necessarily represent the official views of nor an endorsement, by the Kresge foundation. We would like to extend appreciation to our 5 partner organizations for helping to distribute the survey though their networks; Building Healthy Communities, Central California Environmental Justice Network, Central Valley Air Quality Coalition, Faith in the Valley, and Leadership Council for Justice and Accountability. We also thank Dr. Beth Weinman for help to distribute the survey. Without their support this poster would not have been possible.
THE KRESGE FOUNDATION