Polluted Air, Clouded Health: Investigating Air Pollution and Breast Cancer Mortality in California

Public Health Concern
Breast cancer remains a significant public health concern in California, with an age-adjusted breast cancer mortality (BCM) rate of 18.8, whereas, for Fresno County, it is 18.2 per 100,000 over the 5-year average of 2016-2020 (CDC, 2023). The Healthy People 2030 objective for BCM rates is 15.3 per 100,000, and the current mortality rates in California and Fresno County are well above the desired level (Office of Disease Prevention and Health Promotion, n.d.). The well-established risk for breast cancer includes age, reproductive risk factors, genetics, lifestyle, and socioeconomic status. However, there is an emerging risk factor of air pollution gaining recognition for its potential impact on the health and survival of breast cancer patients (DuPré et al., 2019; Hwang et al., 2020; Cheng et al., 2022)
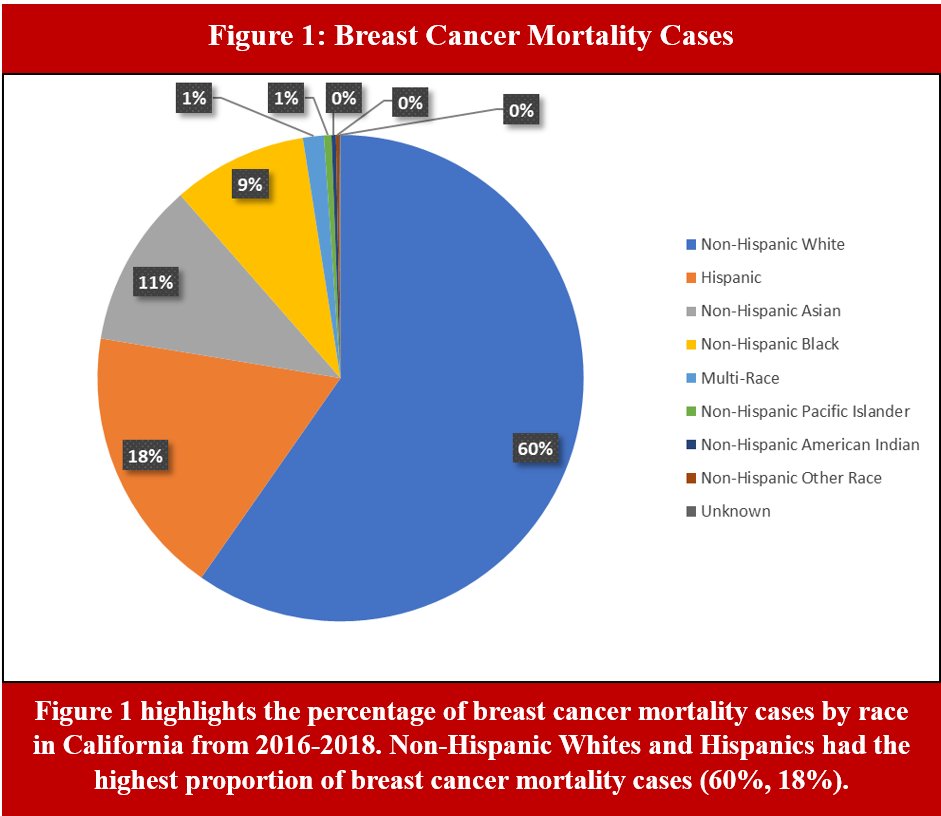
Figure 1: Breast Cancer Mortality Cases
Figure 1 highlights the percentage of breast cancer mortality cases by race in California from 2016-2018. Non-Hispanic Whites and Hispanics had the highest proportion of breast cancer mortality cases (60%, 18%).
| Race | Percentage shown |
|---|---|
| Non-Hispanic White | 60% |
| Hispanic | 18% |
| Non-Hispanic Asian | 11% |
| Non-Hispanic Black | 9% |
| Multi-Race | 1% |
| Non-Hispanic Pacific Islander | 1% |
| Non-Hispanic American Indian | 0% |
| Non-Hispanic Other Race | 0% |
| Unknown | 0% |
Objective
The objective is to examine the potential geographic association between air pollution and BCM rates by women aged 45-64 and 65-85+ in California at the zip code level. By employing a methodological approach using secondary data from the California Department of Public Health Vital Records Data and Statistics, CalEnviroScreen 4.0, and Census, this brief aims to inform policymakers, healthcare professionals, and community members on the geographical disparities present in BCM and risk factors that can be targeted to produce equitable policy changes. Reducing air pollution and addressing its potential role in BCM can lead to better health outcomes and improved quality of life for Californians.
Key Findings
Multiple linear regression was used to test if particulate matter 2.5 (PM2.5), diesel PM2.5, and ozone significantly predicted BCM rates while controlling for the sociodemographic factors of race, poverty, and insurance coverage (see Figure 2 & 3).
- PM2.5 was significantly associated with BCM in both the middle-aged group (b=1.53, 95%
CI=[0.56,2.51]) and the older age group (b=12.67, 95% CI=[10.91,14.47]).
- For example, among the older age group, a one standard deviation (SD) increase in PM2.5 (mg/m3) was associated with an increase in BCM rates by 12.67 per 100,000 women.
- Overall, PM2.5 accounted for 3.8% of the variation in BCM rates.
- Diesel PM2.5 was significantly associated with BCM in both the middle-aged group (b=2.06, 95%
CI=[1.05, 3.07]) and the older age group (b=2.27, 95% CI=[0.35,4.19]).
- For example, among the older age group, a one SD increase in Diesel PM (mg/m3) was associated with an increase in BCM rates by 2.27 per 100,000 women.
- The model explains the variation by 10% (R2 = 0.10, p = <.001) in the middle-aged group and 38% in BCM rates (R2 = 0.38, p = <.001) in the older age group.
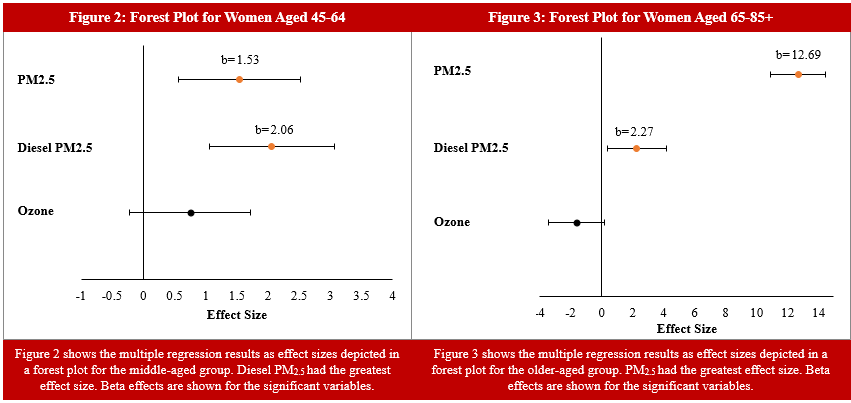
Figure 2: Forest Plot for Women Aged 45-64
Figure 2 shows the multiple regression results as effect sizes depicted in a forest
plot for the middle-aged group. Diesel PM2.5 had the greatest effect size. Beta effects are shown for the significant variables.
Figure 3: Forest Plot for Women Aged 65-85+
Figure 3 shows the multiple regression results as effect sizes depicted in a forest
plot for the older-aged group. PM2.5 had the greatest effect size. Beta effects are shown for the significant variables.
| Age group | Air pollutant | b, as labeled in the figure | 95% confidence interval, as reported in the text |
|---|---|---|---|
| 45-64 | PM2.5 | 1.53 | 0.56 to 2.51 |
| 45-64 | Diesel PM2.5 | 2.06 | 1.05 to 3.07 |
| 65-85+ | PM2.5 | 12.69 | 10.91 to 14.47 |
| 65-85+ | Diesel PM2.5 | 2.27 | 0.35 to 4.19 |
The horizontal axis is labeled Effect Size. It ranges from -1 to 4 in Figure 2 and from -4 to 14 in Figure 3. Ozone is plotted for both age groups, with intervals crossing zero; its beta values are not labeled.
Source note: The text reports b=12.67 for PM2.5 in the older age group; Figure 3 labels that effect b=12.69.
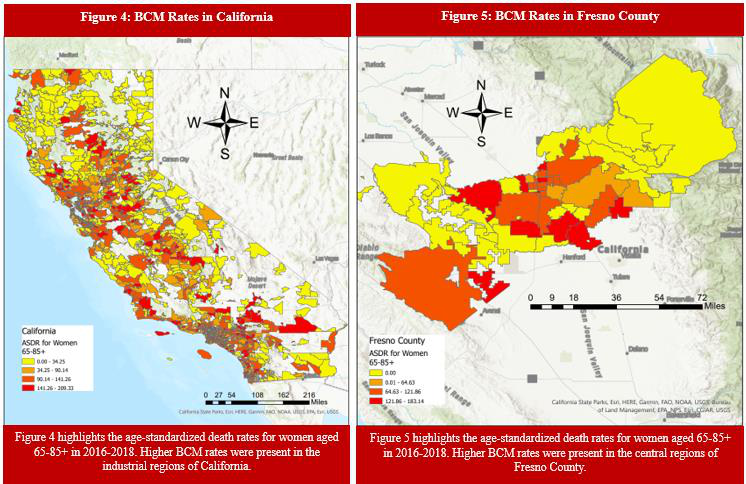
Figure 4: BCM Rates in California
Figure 4 highlights the age-standardized death rates for women aged 65-85+ in 2016-2018.
Higher BCM rates were present in the industrial regions of California.
Figure 5: BCM Rates in Fresno County
Figure 5 highlights the age-standardized death rates for women aged 65-85+ in 2016-2018.
Higher BCM rates were present in the central regions of Fresno County.
| Map | Legend color | Range shown |
|---|---|---|
| California | Yellow | 0.00 to 34.25 |
| California | Light orange | 34.25 to 90.14 |
| California | Dark orange | 90.14 to 141.26 |
| California | Red | 141.26 to 209.33 |
| Fresno County | Yellow | 0.00 |
| Fresno County | Light orange | 0.01 to 64.63 |
| Fresno County | Dark orange | 64.63 to 121.86 |
| Fresno County | Red | 121.86 to 183.14 |
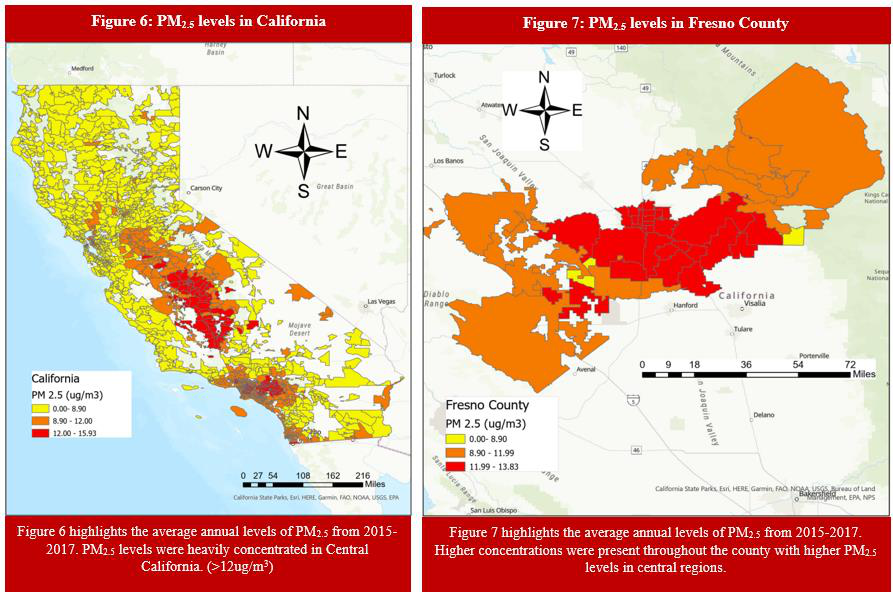
Figure 6: PM2.5 levels in California
Figure 6 highlights the average annual levels of PM2.5 from 2015-2017. PM2.5 levels were heavily concentrated in Central California. (>12ug/m3)
Figure 7: PM2.5 levels in Fresno County
Figure 7 highlights the average annual levels of PM2.5 from 2015-2017. Higher concentrations were present throughout the county with higher
PM2.5 levels in central regions.
| Map | Legend color | PM2.5 range (ug/m3) |
|---|---|---|
| California | Yellow | 0.00 to 8.90 |
| California | Orange | 8.90 to 12.00 |
| California | Red | 12.00 to 15.93 |
| Fresno County | Yellow | 0.00 to 8.90 |
| Fresno County | Orange | 8.90 to 11.99 |
| Fresno County | Red | 11.99 to 13.83 |
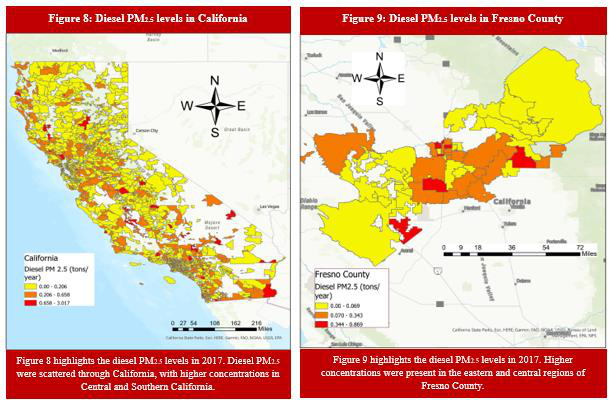
Figure 8: Diesel PM2.5 levels in California
Figure 8 highlights the diesel PM2.5 levels in 2017. Diesel PM2.5 were scattered through California, with higher concentrations in Central and Southern
California.
Figure 9: Diesel PM2.5 levels in Fresno County
Figure 9 highlights the diesel PM2.5 levels in 2017. Higher concentrations were present in the eastern and central regions
of Fresno County.
| Map | Legend color | Diesel PM2.5 range (tons/year) |
|---|---|---|
| California | Yellow | 0.00 to 0.206 |
| California | Orange | 0.206 to 0.658 |
| California | Red | 0.658 to 3.017 |
| Fresno County | Yellow | 0.00 to 0.069 |
| Fresno County | Orange | 0.070 to 0.343 |
| Fresno County | Red | 0.344 to 0.869 |
Source units: The body text uses mg/m3. The PM2.5 maps use ug/m3, and the diesel PM2.5 maps use tons/year. These units are reproduced as printed.
Policy Implication
Leadership at the state and county levels can play a pivotal role in reducing geographic disparities in breast cancer outcomes and determinants. To address health disparities and improve health outcomes, these are the following key policy implications:
Reducing Particulate Matter and Diesel Particulate Matter Emissions
The findings of this analysis suggest that policymakers should consider implementing measures to reduce air pollution levels in regions with elevated BCM rates. This may involve stricter emissions controls, promotion of clean energy sources, and community-level initiatives to improve air quality. Policymakers should incentivize cleaner technologies and a transition to renewable energy sources to help lower air pollution levels.
Increasing Health Education and Awareness Programs
Additionally, efforts to enhance breast cancer screening and access to healthcare services, particularly in areas with high mortality rates should be a priority. A holistic approach that combines environmental and healthcare interventions can lead to tangible improvements in breast cancer outcomes across California.
Conclusion
This spatial analysis of BCM and its potential association with air pollution at the zip code level in California offers critical insights into public health concerns. Along with air pollution, the percentage of the population that is privately insured was significantly associated with BCM in the older age group (b=26.85, 95% CI=[25.24,28.46]). The percentage of African Americans was also significantly associated with BCM in both the middle-aged group (b=2.79, 95% CI=[1.89,3.69]) and the older age group (b=2.75, 95% CI=[1.11,4.39]). While the findings may indicate statistical associations, it is essential to acknowledge the multifaceted nature of BCM, with various factors contributing to the observed patterns. Further research and a deeper exploration of potential mechanisms are warranted to establish causality definitively and to verify the current findings.
Methods
To conduct this analysis, data from the California Department of Public Health Vital Records Data and Statistics was utilized from the years 2016-2018, focusing on females who died of breast cancer (ICD-10 Code of C500-C509). The data was aggregated by zip code and age at the time of death, which was stratified into 14 age groups ranging from 25 to 85+ years. Age-adjusted mortality rates were calculated using the 2016-2018 census population data for females for each zip code. The age-adjusted mortality rates were averaged for ages 45-64 and 65-85+ so comparisons can be made between the middle-aged and older age groups.
Multiple linear regression analysis was performed to investigate the statistical significance of the relationship between air pollutants and breast cancer mortality. Particulate matter 2.5 (PM2.5), diesel PM2.5, and ozone were examined as explanatory variables, focusing on their potential impact on breast cancer mortality rates. The sociodemographic variables included were poverty and African-American from the CalEnviroScreen 4.0 dataset. Census data was utilized to obtain the percentage of individuals with private insurance coverage at the zip code level.
Suggested Citation: Sekhon, D., & Alcala, E. (2023). Polluted Air, Clouded Health: Investigating Air Pollution and Breast Cancer Mortality in California. Central Valley Health Policy Institute. CVHPI.org/
References
- Centers for Disease Control and Prevention. (2023, June). USCS data visualizations - CDC. Centers for Disease Control and Prevention. https://gis.cdc.gov/Cancer/USCS/#/AtAGlance/
- Cheng, I., Tseng, C., Wu, J., Yang, J., Conroy, S.M., Shariff-Marco, S., Li, L., Hertz, A., Gomez, S.L., Le Marchand, L., Whittemore, A.S., Stram, D.O., Ritz, B. and Wu, A.H. (2020), Association between ambient air pollution and breast cancer risk: The multiethnic cohort study. Int. J. Cancer, 146: 699-711. https://doi.org/10.1002/ijc.32308
- DuPré, N. C., Hart, J. E., Holmes, M. D., Poole, E. M., James, P., Kraft, P., Laden, F., & Tamimi, R. M. (2019). Particulate Matter and Traffic-Related Exposures in Relation to Breast Cancer Survival. Cancer epidemiology, biomarkers & prevention : a publication of the American Association for Cancer Research, cosponsored by the American Society of Preventive Oncology, 28(4), 751–759. https://doi.org/10.1158/1055-9965.EPI-18-0803
- Hwang, J., Bae, H., Choi, S., Yi, H., Ko, B., & Kim, N. (2020). Impact of air pollution on breast cancer incidence and mortality: a nationwide analysis in South Korea. Scientific reports, 10(1), 5392. https://doi.org/10.1038/s41598-020-62200-x
- Office of Disease Prevention and Health Promotion (ODPHP). (n.d.). Reduce the female breast cancer death rate - C-04. Healthy People 2030. https://health.gov/healthypeople/objectives-and-data/browse-objectives/cancer/reduce-female-breast-cancer-death-rate-c-04
Central Valley Health Policy Institute
California State University, Fresno
1625 East Shaw Avenue, Suite 146 M/S OF126 - Fresno, California 93710-8106
P 559.228.2150 F 559.228.2168 www.FresnoState.edu/chhs/cvhpi/
THE CALIFORNIA STATE UNIVERSITY
DISCOVERY. DIVERSITY. DISTINCTION.
