Geospatial Analysis of the Association between Food Deserts, Transportation, and Hypertension Prevalence in California
Grant Mendoza, MPH Candidate, Emanuel Alcala, PHD
Fresno State
Central Valley Health Policy Institute
16
Background
- In the United States, about 120 million adults are diagnosed with hypertension.
- In California, hypertension prevalence is 27.9%, and a mortality rate of 14.7%.
- Individual-level risk factors
- Diet, physical activity, and genetics.
- Geospatial risk factors
- Food deserts w/ transportation, walkability, park access, and urban/rural status at the census tract level.
- Testa (2021) and Suarez (2015) both investigated food deserts and their association with hypertension, but they used individual-level data rather than other community-level measures.
- Green and colleagues (2022) state that future research should focus on community-level socioeconomic status and hypertension prevalence to better understand the determinants of hypertension.
- Koh and colleagues (2022) suggest further research on green spaces and health outcomes to better understand green spaces.
Problem Statement
- There is a significant gap in research in understanding the association of geospatial factors with hypertension prevalence in California at the census tract level.
- To my knowledge, there is no comprehensive study that investigates the combined effects of geospatial factors such as food deserts w/ transportation, walkability, park access, and urban/rural status on hypertension prevalence in California at the census tract level.
Research Question
- Is there an association between hypertension prevalence and geospatial factors such as food deserts w/ transportation, walkability, park access, and urban/rural status in California at the census tract level?
Methods
Databases and Measures
- CDC PLACES
- Hypertension prevalence (DV)
- USDA Food Access Research Atlas
- Food desert w/ transportation and urban/rural status
- Healthy Places Index 3.0
- Access to healthcare, park access, race/ethnicity, poverty, education
- American Community Survey
- Age
- National Walkability Index
- Walkability score
Data Processing
- The data was cleaned to remove missing values, outliers, or errors affecting the analysis.
- The independent variables were standardized by Z-score.
- To avoid collinearity issues, a composite score named “cumulative socioeconomic advantage”
was created with the following measures:
- access to healthcare, education, and above-poverty.
Data Analysis
- Univariate
- Frequency distribution and descriptive statistics
- Bivariate
- Simple linear regression
- Multivariate
- Multiple linear regression
Results
Maps and Descriptive Results
Figure 1. Map of Hypertension Prevalence by Census Tracts, California, 2021
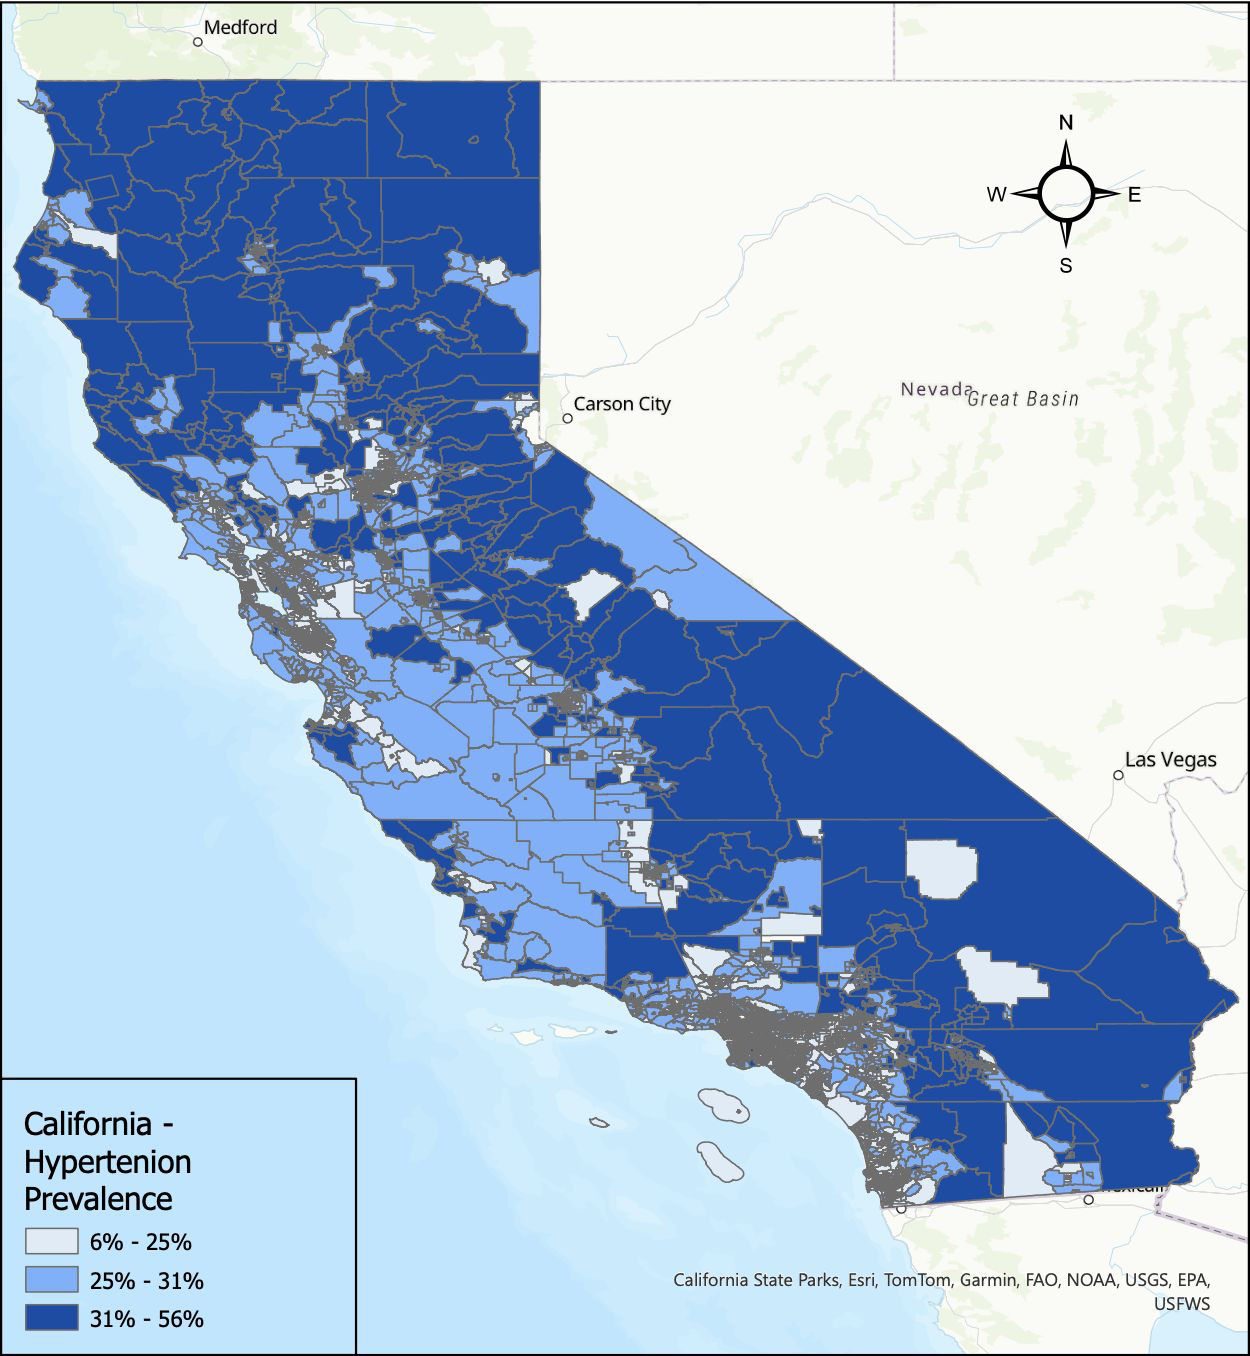
- Figure 1, shows prevalence of hypertension. The darkest shade of blue represents 31% - 56%.
- The medium shade of blue represents 25% - 31%.
- The lowest values are 6% - 25% and represent the light shade of blue.
Figure 2. Map of Food Deserts Lacking Transportation by Census Tracts, California, 2019
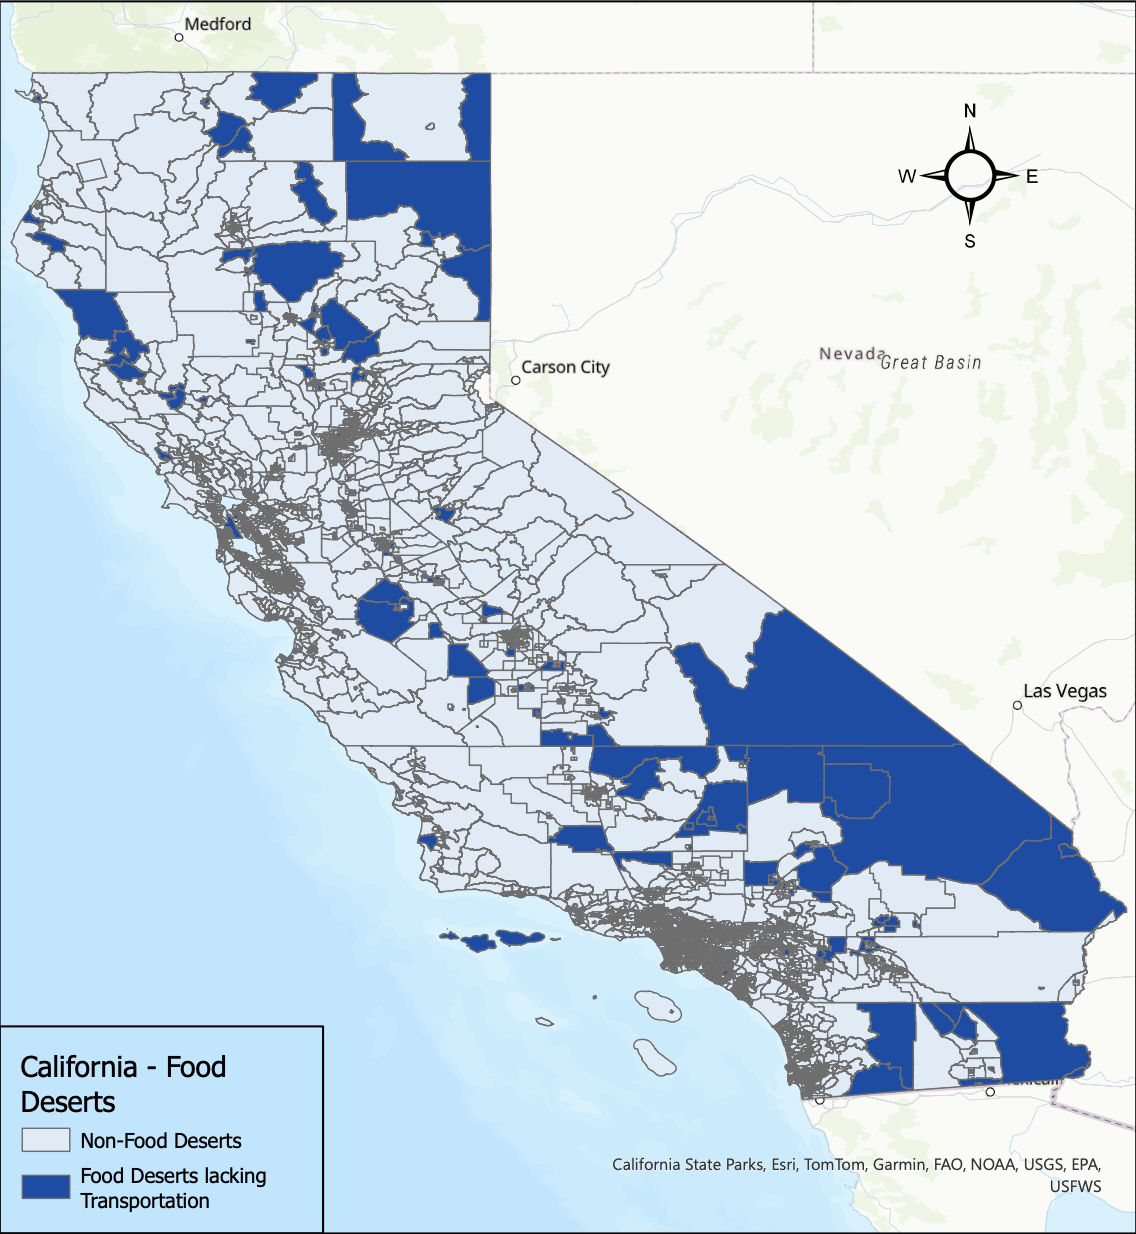
- Figure 2, shows food deserts lacking transportation. The darkest shade of blue represents food deserts lacking transportation.
Figure 3. Map of Cumulative Socioeconomic Advantage by Census Tracts, California, 2022
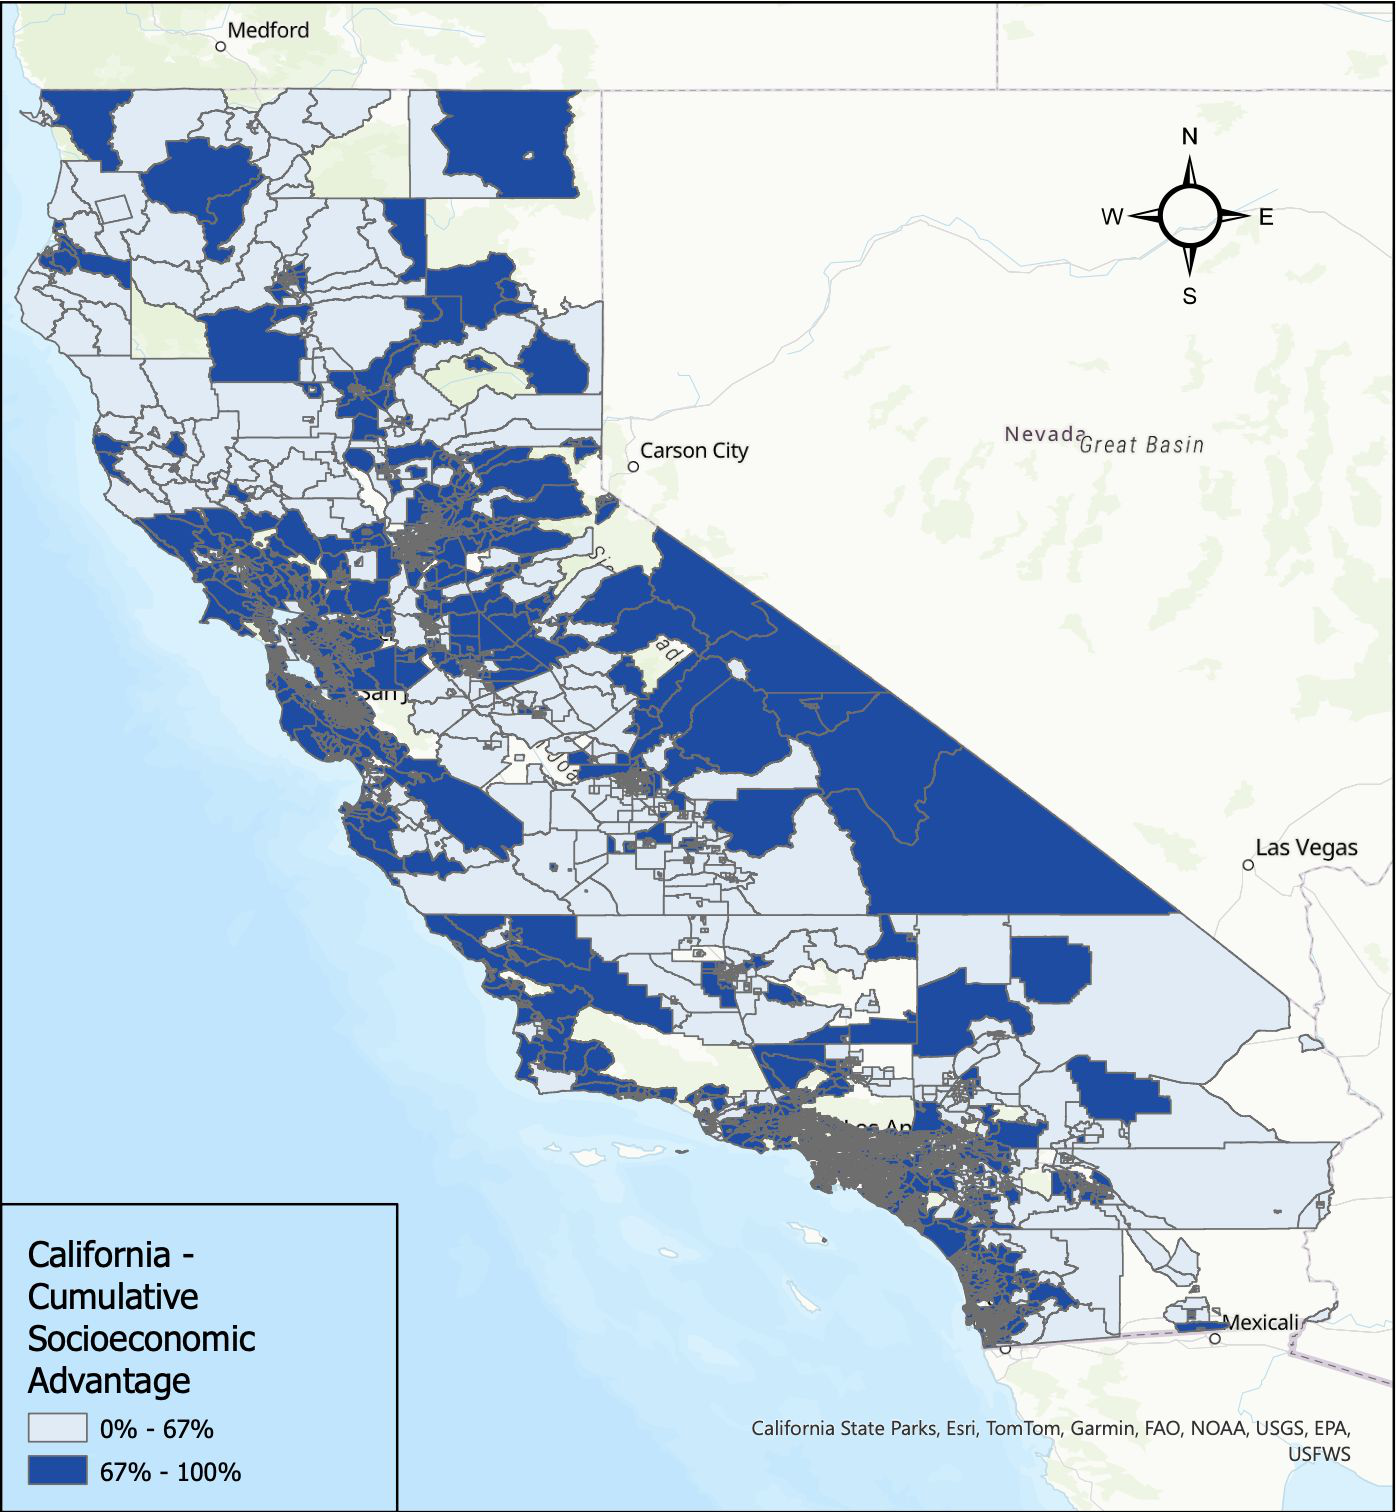
- Figure 3, shows cumulative socioeconomic advantage. The darkest shade of blue represents 67% - 100% which indicates a higher advantage.
- The lighter shade of blue represents 0% - 67%, or a disadvantaged tract.
Figure 4. Map of Percent Age 55+ by Census Tracts, California, 2019
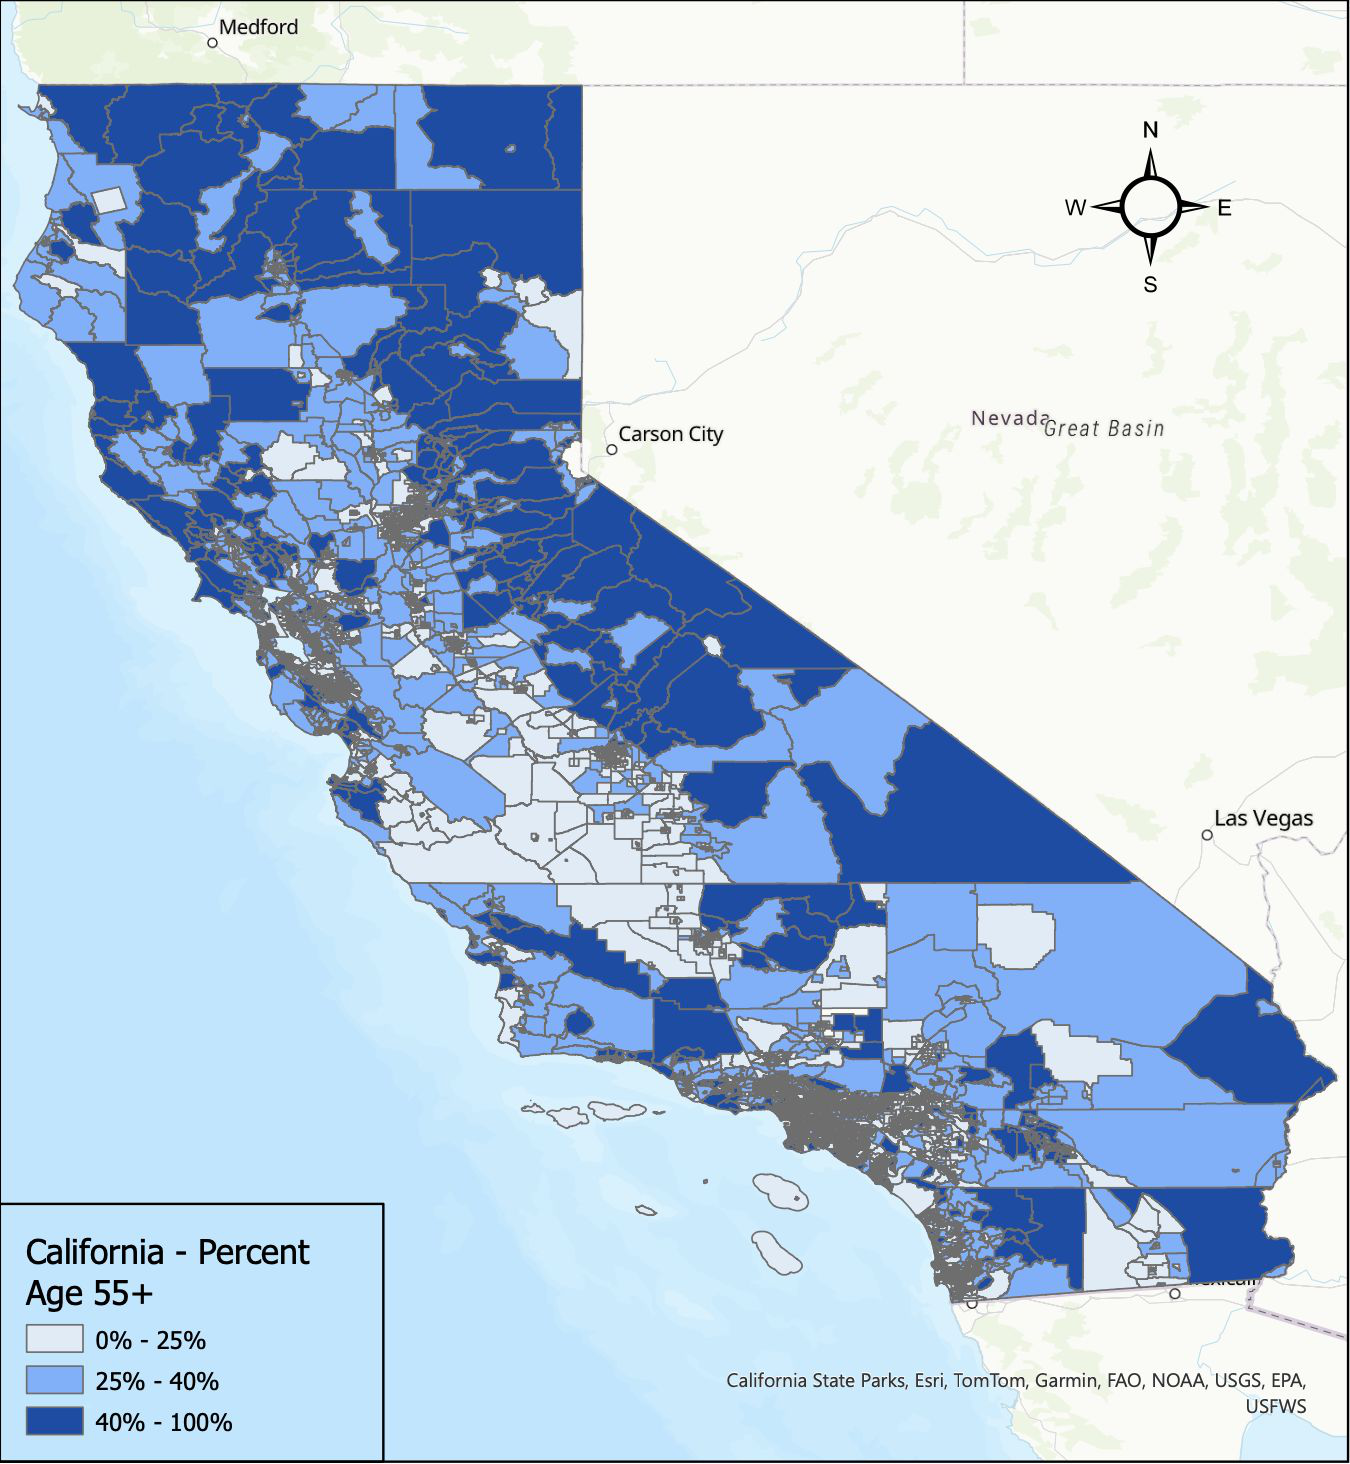
- Figure 4, shows percent age 55+. The darkest shade of blue represents 40% - 100%.
- The medium shade of blue represents 25% - 40%.
- The lowest values are 0% - 25%, and are indicated by the light shade of blue.
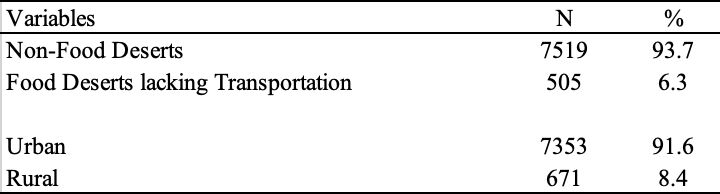
| Variables | N | % |
|---|---|---|
| Non-Food Deserts | 7519 | 93.7 |
| Food Deserts lacking Transportation | 505 | 6.3 |
| Urban | 7353 | 91.6 |
| Rural | 671 | 8.4 |
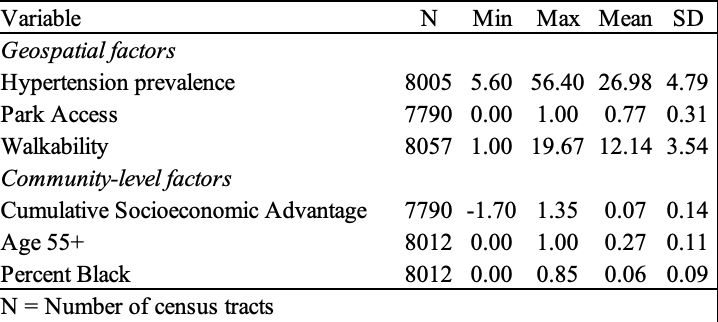
| Variable | N | Min | Max | Mean | SD |
|---|---|---|---|---|---|
| Geospatial factors | |||||
| Hypertension prevalence | 8005 | 5.60 | 56.40 | 26.98 | 4.79 |
| Park Access | 7790 | 0.00 | 1.00 | 0.77 | 0.31 |
| Walkability | 8057 | 1.00 | 19.67 | 12.14 | 3.54 |
| Community-level factors | |||||
| Cumulative Socioeconomic Advantage | 7790 | -1.70 | 1.35 | 0.07 | 0.14 |
| Age 55+ | 8012 | 0.00 | 1.00 | 0.27 | 0.11 |
| Percent Black | 8012 | 0.00 | 0.85 | 0.06 | 0.09 |
N = Number of census tracts
- The walkability average of 12.14 equates to an average of 65% walkable per census tract.
- The Cumulative Socioeconomic Advantage average of 0.07 equates to 42% advantage per census tract.
Figure 5. Map of Walkability by Census Tracts, California, 2021
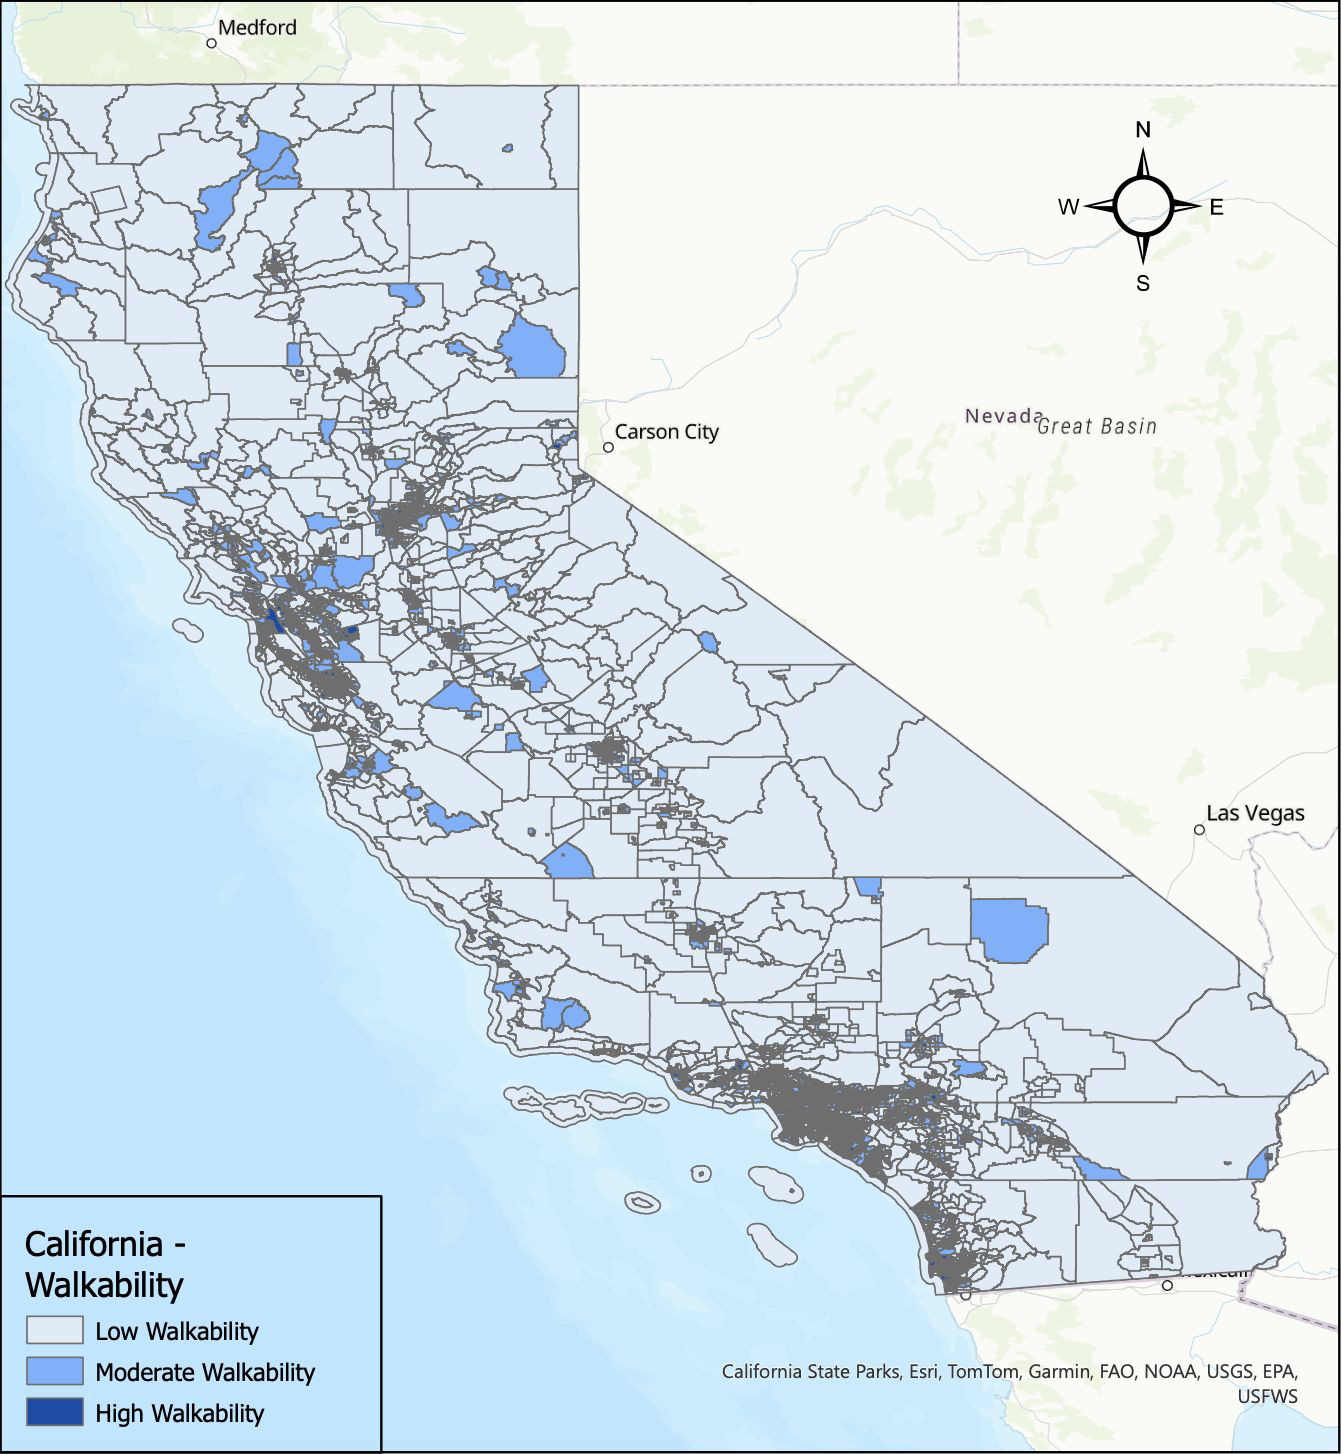
- Figure 5, shows walkability. The darkest shade of blue represents census tracts of high walkability.
- The medium shade of blue represents moderate walkability.
- The light shade of blue represents low walkability.
Multiple Linear Regression
| Variables | B | Std. Error | 95% CI | P |
|---|---|---|---|---|
| (Constant) | 27.23 | .126 | 26.98, 27.48 | 0 |
| Food Deserts lacking Transportation | 1.96 | .123 | 1.72, 2.20 | <.001 |
| Cumulative Socioeconomic Advantage | -2.84 | .040 | -2.92, -2.76 | <.001 |
| Age 55+ | 3.94 | .036 | 3.87, 4.01 | <.001 |
| Percent Black | 1.05 | .031 | .99, 1.10 | <.001 |
| Walkability | -.37 | .037 | -.44, -.29 | <.001 |
| Park Access | -.15 | .032 | -.21, -.08 | <.001 |
| Urban | -.32 | .132 | -.58, -.06 | 0.015 |
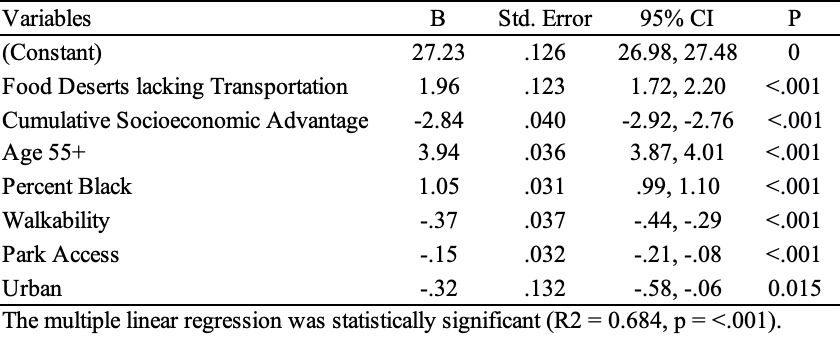
The multiple linear regression was statistically significant (R2 = 0.684, p = <.001).
The Final Analysis shows:
- Areas lacking access to healthy food options due to transportation issues have a positive association with hypertension prevalence (b = 1.96; 95% CI 1.72, 2.20).
- Higher cumulative socioeconomic advantage is associated with lower hypertension prevalence (b = -2.84; 95% CI -2.92, -2.76).
- Communities with higher percentages of individuals aged 55 and above were found to have an increased risk of hypertension (b = 3.94; 95% CI 3.87, 4.01).
- All variables have statistically significant relationships with hypertension prevalence (p < .001).
- The adjusted R-squared value of .684 indicates that the model explains approximately 68.4% of the variance in hypertension prevalence.
Source note: The poster’s narrative states that all variables have p < .001; its regression table reports p = 0.015 for Urban.
Discussion
Hypertension Prevalence Disparities
- Significantly higher prevalence in food deserts compared to non-food desert areas.
- Hypertension prevalence increased with communities of an increased percentage of 55 and older.
- Increased socioeconomic advantage associated with reduced hypertension risk.
Consistency with Existing Literature:
- Testa and colleagues (2021) found food deserts were linked to a heightened risk of hypertension.
- Identified gaps in methodologies regarding food deserts and socioeconomic measures.
- Extension Beyond Individual-Level Analyses:
- This study utilizes a food desert measure that incorporates transportation and low income.
- Provides a comprehensive understanding beyond individual-level analyses in prior studies.
Limitations
- There was no control over how the data was collected and what quality control measures were taken, which can impact the accuracy and reliability of the findings.
- The data may have inherent biases due to the original purpose of the data collection or the source of the data.
- Due to the cross-sectional nature of the datasets, causality could not be established.
Policy Implications and Future Research
- Policy:
- Implement community garden or farmer’s markets in food deserts.
- Enhance public transportation options.
- Future Research:
- Prospective cohort study design.
- Consider additional features of food environments.
- Include a measure to account for food delivery services.
Conclusion
This study conducted a thorough analysis of secondary data obtained from various sources to assess the association between hypertension prevalence and geospatial factors such as food deserts lacking transportation, walkability, park access, and urban/rural status in California at the census tract level. The study found significant differences in hypertension prevalence between food deserts lacking transportation and non-food desert census tracts, cumulative socioeconomic advantage, age, walkability, park access, and race/ethnicity. These findings suggest that access to healthy food options plays a vital role in preserving good health, particularly in the management of hypertension.
Acknowledgements
- I would like to thank each of my committee members for their guidance and time.
- Thank you, Dr. Garza, Dr. Rahman, Dr. Alcala, and Dr. Quinonez, for all the support you have provided during this process.
RESEARCH POSTER PRESENTATION DESIGN © 2011
www.PosterPresentations.com
http://www.facebook.com/pages/PosterPresentationscom/217914411419?v=app_4949752878&ref=ts