Food Deserts and Hypertension Prevalence in the Central Valley
Policy Brief
The Problem
Hypertension is the leading contributing cause of premature death worldwide (WHO, 2023). Over 1.2 billion adults worldwide have hypertension, and approximately 46% are unaware of this condition (WHO, 2023). In the state of California, the mortality rate for hypertension is 14.7 per 100,000, ranking the third highest state (CDC, 2022). Disparities in hypertension exist by geographic location. The prevalence of hypertension in the state of California is 27% while in the San Joaquin Valley region is approximately 32% (“Source: 2022 California Health Interview Survey”).
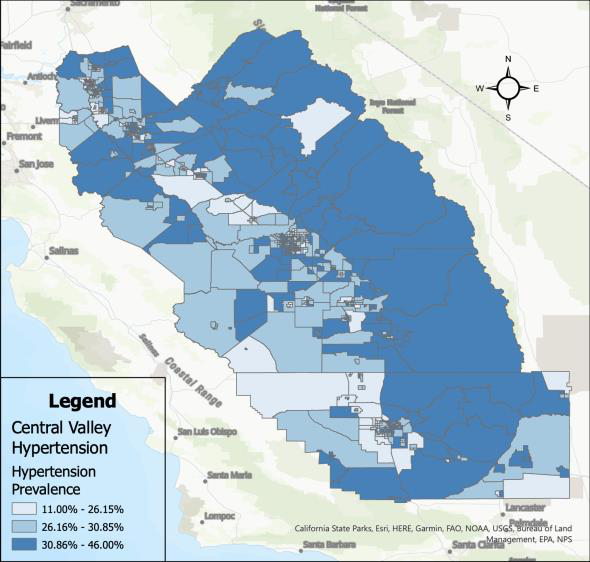
Rural areas tend to have the highest prevalence of hypertension compared to urban census tracts.
Objective
The objective was to identify and examine place-based factors associated with geographic variation in hypertension. We conducted a cross-sectional analysis of food deserts and hypertension prevalence in the San Joaquin Valley of California by census tract.
Methodological Approach
Measures
- Hypertension was defined as the percentage of the population aged 18 years or older who has ever been diagnosed by a physician (PLACES, n.d.).
- A food desert was defined as a majority of the census tract being far from a supermarket, supercenter, or large grocery store with low vehicle availability (ERS, 2021). A tract is considered to have low vehicle availability if there are over 100 households in the area that do not have any vehicle available, and the nearest supermarket is more than half a mile away (ERS, 2021).
- Tree canopy coverage was defined as the percent of land with tree canopy, after adjusting for the number of people per acre (Bodenreider et al., 2022).
- The cumulative advantage variable is composed of three separate variables: Access to Insurance, Education, and Above Poverty.
Data Analysis
- Means and standard deviations were used to examine the data descriptively.
- Multivariate ordinary least squares regression was used to assess the strength of the association between the factors and hypertension prevalence.
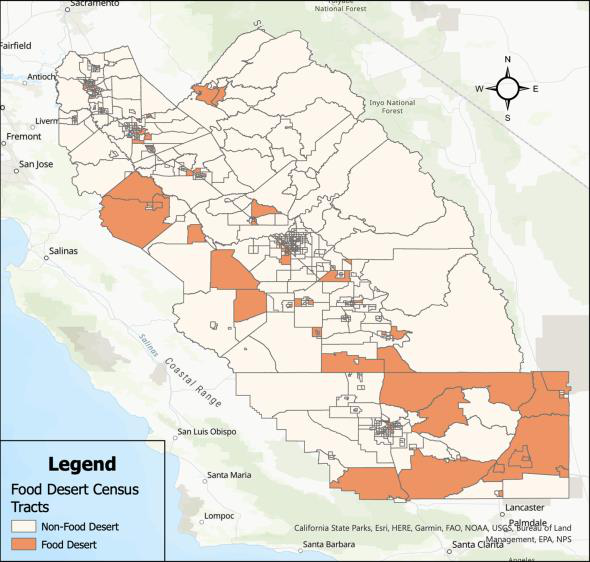
Rural areas tend to be located in food deserts compared to urban census tracts.
Key Findings
- Figure 1 illustrates the prevalence of hypertension in the Central Valley by census tract. The census tracts range from 11% to 46% prevalence in hypertension.
- Figure 2 illustrates food deserts in the Central Valley. The darker orange areas represent census tracts that have been identified as areas of low income and low access to grocery stores. In the Central Valley, approximately 16 percent (n = 123) of communities reside in food deserts.
- Table 1 shows the means of hypertension prevalence, cumulative advantage, park access, tree canopy coverage, and percent black of food deserts in the Central Valley.
- Table 1 shows the mean and standard deviation of hypertension prevalence by access to grocery stores. Low-access communities (M=31.28; SD= 4.16) had a significantly higher hypertension prevalence than high-access communities (M=29.38; SD= 3.63).
- Table 2 shows the results of a multivariate linear regression modeling hypertension prevalence.
- Food deserts were significantly associated with hypertension prevalence (b= 1.63; 95% CI [0.977, 2.273]). On average, low-access communities had a 1.6% higher prevalence of hypertension than high-access communities.
- Cumulative advantage was negatively associated with hypertension prevalence (b= -1.65; 95% CI [-1.988, -1.311]). On average, communities with high cumulative advantage had a 1.6% decrease in hypertension prevalence compared to communities with low cumulative advantage.
| Variables | Mean | Standard Dev |
|---|---|---|
| High Access | 29.38 | 3.63 |
| Low Access | 31.28 | 4.16 |
Table 1 shows the means of hypertension prevalence in non-food desert and food desert census tracts, respectively. Hypertension prevalence is higher in food desert census tracts than in non-food deserts.
| Variable | Beta | 95% C.I. Lower Bound | 95% C.I. Upper Bound |
|---|---|---|---|
| (Constant) | 29.3 | 28.934 | 29.666 |
| Food Deserts | 1.63 | 0.977 | 2.273 |
| Cumulative Advantage | -1.65 | -1.988 | -1.311 |
| Tree Canopy Coverage | 1.74 | 1.446 | 2.026 |
Table 2 shows a multiple linear regression between hypertension prevalence, food deserts, cumulative advantage, and tree canopy coverage. Food desert census tracts have a 1.63% increase in hypertension prevalence than non-food deserts.
Policy Recommendations
-
One policy recommendation for addressing hypertension in food deserts is to increase access to healthy foods. This can be achieved through policies that encourage the development of supermarkets and grocery stores in food deserts, as well as through the creation of community gardens and farmers’ markets. Opening new full-service grocery stores in underserved communities can increase access to healthy food, reduce travel time and transportation costs for residents, and offer a wider variety of healthy food options. Grants and loans are available to help new stores open in these communities, and the state can facilitate access to these funds by sharing information about available grants and application procedures through local governments and permitting agencies.
-
Additionally, policies that incentivize the sale of healthy foods and the reduction of unhealthy food options in food deserts can also be effective. One choice would be to implement a food tax and subsidy policy to decrease the sales of heavily processed foods and increase the accessibility of healthier food options (Blakely et al., 2020). This strategy has been supported by evidence and shows an increase in health-adjusted life years (HALYs).
-
Finally, increased access to public transportation options would make it easier for residents of food deserts to access healthy food options outside of their communities. Residents of identified food deserts tend to be of low-income and lack access to reliable means of transportation.
Suggested Citation: Mendoza, G., & Alcala, E. (2024). Food Deserts and Hypertension Prevalence in the Central Valley. Central Valley Health Policy Institute. URL: https://chhs.fresnostate.edu/cvhpi/publications/datainfographics.html