Unequal Neighborhoods: Merced
Presented by: Tania Pacheco-Werner, PhD
Corona, G., Corona, K., Conley, A., Jansky, A., Pacheco-Werner, T. L., Ramirez, A., & Garcia, M. (2024). Unequal Neighborhoods Merced. Central Valley Health Policy Institute. California State University, Fresno.
Nestled in the fertile San Joaquin Valley (SJV), an agricultural belt extending 300 miles through the center of California and just 110 miles from Silicon Valley, lies Merced County, California, which is home to 271,579 people.
Merced, along with other areas of the SJV, has a history of policies that have shaped unequal neighborhoods, including racial segregation.
Historical land use patterns laid the foundation for rural and urban racially segregated areas of poverty, and the legacy of racist policies and housing discrimination continues to affect communities today. Segregated and unequal neighborhoods in Merced did not happen by chance, but rather were intentionally created.
For the purpose of Unequal Neighborhoods, two categories were created to demonstrate the impact of these policies on neighborhoods directly: the first is the BHC Place and Advantaged Neighborhoods.
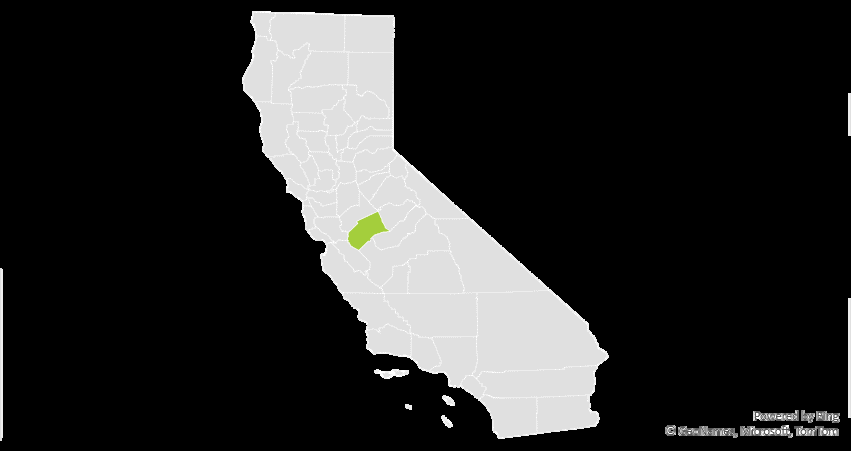
The BHC Place
The Merced BHC Place is comprised of 64,293 people and covers 14 census tracts in and around the city of Merced.
These areas include places where historical race-based discrimination occurred, such as where immigrant communities were often isolated by local ordinances.
Over time, these areas faced continued disinvestment and lacked amenities, such as parks and grocery stores, but were also missing vital infrastructure and transportation access necessary for what is defined as complete neighborhoods.
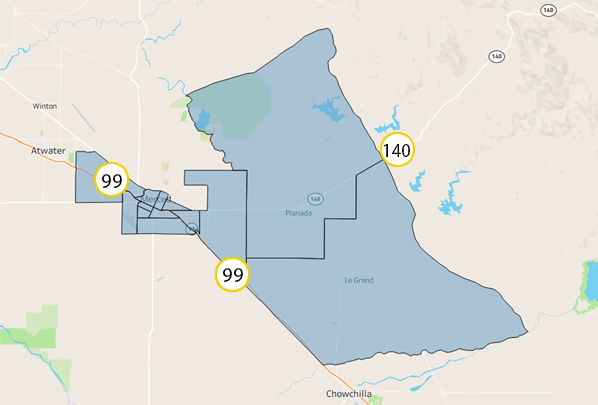
Advantaged Neighborhoods
Advantaged Neighborhoods are comprised of 60,461 people and cover 11 census tracts in and around the city of Merced.
These neighborhoods include mostly northern Merced, where there is a concentration of amenities, including:
- Parks
- Grocery stores,
- Investments in infrastructure,
- As well as the University of California-Merced campus and its resources.
Demographics
| Neighborhood group | Bachelor’s degree or higher |
|---|---|
| The BHC Place | 12% |
| Advantaged Neighborhoods | 22% |
| Race/Ethnicity | The BHC Place | Advantaged Neighborhoods |
|---|---|---|
| Black | 4.4% | 3.8% |
| Pacific Islander | 0.2% | 0.2% |
| White | 23.2% | 41.7% |
| American Indian | 0.5% | 0.6% |
| Asian | 8.7% | 7.7% |
| Two or more races | 1.8% | 2.5% |
| Hispanic/Latino | 61.3% | 43.4% |
AIAN: American Indian and/or Alaska Native.
Pacific Islander: Including Native Hawaiian.
Education
Gifted Programs
Race/ethnicity demographics for Gifted and Talented Education (GATE) programs looks different between Merced schools in the BHC Place and schools in Advantaged Neighborhoods.
However, aside from these differences, schools in Advantaged Neighborhoods are more likely to have access to GATE programs.
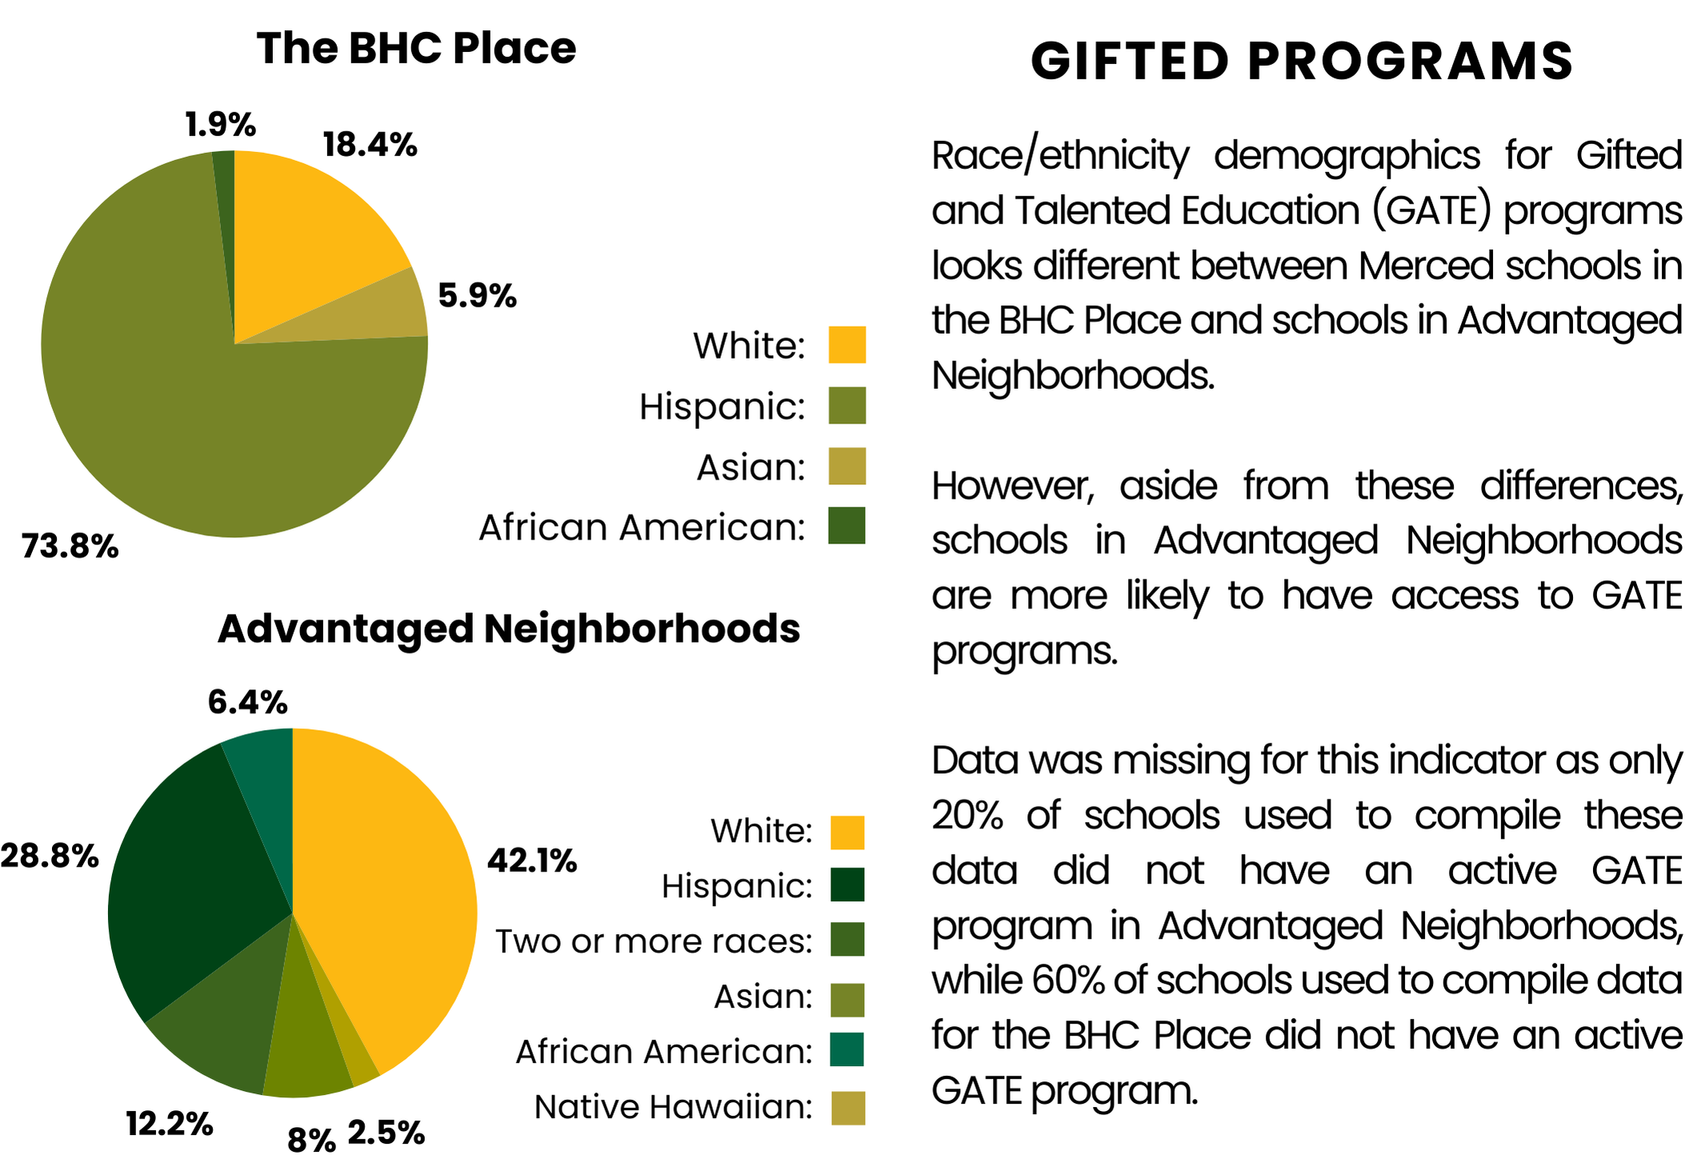
| Race/Ethnicity | The BHC Place | Advantaged Neighborhoods |
|---|---|---|
| White | 18.4% | 42.1% |
| Hispanic | 73.8% | 28.8% |
| Asian | 5.9% | 8% |
| African American | 1.9% | 6.4% |
| Two or more races | Not shown | 12.2% |
| Native Hawaiian | Not shown | 2.5% |
“Not shown” indicates that the category is not included in the original chart for that group.
Data was missing for this indicator as only 20% of schools used to compile these data did not have an active GATE program in Advantaged Neighborhoods, while 60% of schools used to compile data for the BHC Place did not have an active GATE program.
| School group | Percentage without an active GATE program |
|---|---|
| The BHC Place | 60% |
| Advantaged Neighborhoods | 20% |
Environment
Diesel Emissions
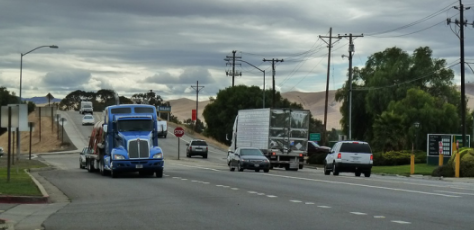
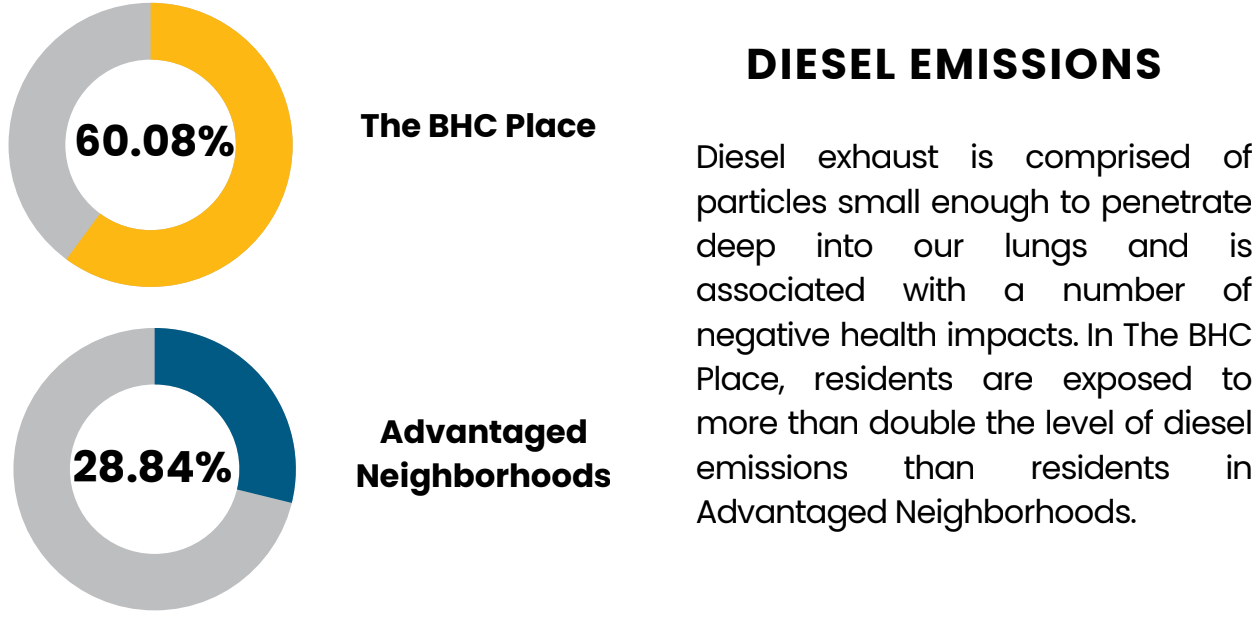
Diesel exhaust is comprised of particles small enough to penetrate deep into our lungs and is associated with a number of negative health impacts. In The BHC Place, residents are exposed to more than double the level of diesel emissions than residents in Advantaged Neighborhoods.
| Neighborhood group | Percentage shown |
|---|---|
| The BHC Place | 60.08% |
| Advantaged Neighborhoods | 28.84% |
Neighborhood
Severe Housing Burden
Severe housing burden is defined by housing costs exceeding 50% of household income. Being housing burdened limits a household’s ability to invest in healthy opportunities and choices. In The Place, there are approximately 12% more people experiencing severe housing burden than in the Advantaged Neighborhoods.
| Neighborhood group | Percentage shown |
|---|---|
| BHC Merced Neighborhoods | 22.86% |
| Advantaged Neighborhoods | 9.67% |
For more information, visit us at
Thank you to advocates and residents for their work.
Thank you to our funders who made this work possible.