Racial Equity Analysis of Fresno and Madera VI-SPDAT Data
OCTOBER 2024
Devloped by: Central Valley Health Policy Institute
Acknowledgements
Special thanks to our funders, RH builders and Fresno-Madera Continuum of Care, whose efforts to increase equity for our local unhoused community made this project possible.
Authors
- Davenna Morales, BS
- Kiana Crisosto, MA
- Dustin Hedrick, BA
- LaMecia Ward, MPH
- Marcella S. Lopez-Schmidt
- Emanual Alcala, PhD
- Tania Pacheco-Werner, PhD
Contact
Tania Pacheco-Werner, PhD
Executive Director
Central Valley Health Policy Institute
Suggested Citation
Morales, D., Crisosto, K., Hendrick, D., Ward, L., Lopez-Schmidt, M., Alcala, E., & Pacheco-Werner, T. (2024). Racial Equity Analysis of Fresno Madera VI-SPDAT Data. Central Valley Health Policy Institute. California State University, Fresno.
Project Background
The Central Valley Health Policy Institute (CVHPI) was contracted by the Fresno-Madera Continuum of Care (FMCoC) to create the Coordinated Entry System Matching Assessment Tool (CESMAT), a new assessment tool to replace the Vulnerability Index - Service Prioritization Decision Assistance Tool (VI-SPDAT) in the housing matching process. As the VI-SPDAT was proven to be inequitable and criticized for its inability to measure community specific needs, the CESMAT aims to equitably evaluate vulnerability among Black, Native, Indigenous, Latine, Asian, Pacific Islander, other People of Color, and people of different sexual orientations and gender identities within Fresno and Madera counties. As a smaller part of this tool’s development, CVHPI conducted a racial equity analysis to investigate racial disparities in housing prioritization assignments within Fresno and Madera counties. Based on our analysis, we found that Black, Indigenous, and other people of color (BIPOC) were more likely to respond with “No” to a majority of assessment questions on the VI-SPDAT for Singles (a version of the VI-SPDAT tailored for individual adults-versus familles or youth-in need of housing services). This led to their overrepresentation in Rapid Rehousing assignments compared to White counterparts. The results demonstrate that the VI-SPDAT’s question phrasing may contribute to BIPOC clients receiving a prioritization score that does not accurately reflect the severity of their current housing situation. This may lead to subsequent assignments to housing services that may not adequately meet their level of need. Therefore, in an effort to create a more equitable tool for the housing matching process and address housing assignment inequities, this report advocates for and disseminates the separate evaluation of vulnerability and acuity. It also maintains equity, trauma informed care, and cultural humility with developing CESMAT items.
Introduction
Across 44 Continuums of Care (CoC) within California, FMCoC experiences one of the highest rates of homelessness, standing as the 9th largest serving CoC (State of California Business, Consumer Services and Housing Agency, n.d.). According to FMCoC’s 2023 Point-in-Time count report, homelessness rates rose to 4,493, a 7% increase from the previous year (Fresno-Madera Continuum of Care, n.d.). However, homelessness in Fresno County is not an isolated issue, as a long history of racism in housing and considerable local barriers exacerbate the inequity observed.
Dating back to the 1870s, Fresno’s history of racial housing segregation was prompted by the coaction of White Fresnans and public policies centered on safekeeping the desirable east side neighborhoods of Fresno for Whites only. Thus, segregated ghettos of Chinese-Americans were formed on the west side, and Black Americans in the southwest. With Fresno’s growth came city plans reinforcing this segregation through zoning laws and redlining, steering investments that would benefit affluent White residents in the north, while approving the development of heavy industry in neighborhoods only attainable by poor and minority populations. Today, Fresno’s racial composition and distribution mirrors these early segregation patterns (Rowen et al., 2020; Thebault, 2018). Racist policies and practices within employment have also contributed by pushing marginalized communities to undervalued occupations, where they are typically the first to experience layoffs or income impacts during economic downturns. Additionally, BIPOC populations within California experience the highest rates of unemployment. Collectively, these contribute to greater economic insecurity, a primary indicator of experiencing homelessness (ICF, 2023).
The legacy of geographical racial isolation - in combination with - the lack of financial, educational, and socio-economic resource allocation in these areas has kept historically poor and undesirable areas vulnerable. With budget cuts to mental health services, citizens live in environmentally unsafe and high crime neighborhoods, and these constituents hold strained access to quality health care. So, for the 55.6% of Black and 58.7% of Latine Fresnan households in relative poverty, homelessness is a closer reality than the opportunity for upward economic mobility (e.g., California Health Care Foundation, 2009; Central Valley Health Policy Institute, 2021; Fresno Economic Opportunities Commission, 2022; Kaiser Permanente Fresno Medical Center, 2022; Public Policy Institute of California, 2023).
The existence of several barriers against upward mobility for housed Fresnans extends to the unhoused as well. Escaping homelessness in Fresno County remains difficult for individuals, families, and transitional youth when available shelters and beds are near capacity - on top of long housing waitlists (Center on Budget and Policy Priorities, 2021,Table 2; Fresno-Madera Continuum of Care, n.d.). In addition to the previously mentioned systemic disadvantages, many face the risk of homelessness because of housing cost burdens, limited rental assistance and eviction protection programs, and employment stability (e.g., California Housing Partnership, 2024).
The VI-SPDAT
In 2013, the VI-SPDAT was developed by OrgCode as a mechanism to assign housing resources to those at highest risk of chronic homelessness, as required by the HEARTH Act (McCauley & Reid, 2020). Completed through an interview format, this triage tool aims to assist communities in distributing limited resources and allocating housing in a more equitable manner than was previously established (De Jong, n.d.). The 27 questions of the VI-SPDAT are categorized within the following domains: History of Housing and Homelessness, Risks, Socialization and Daily Functioning, and Wellness. These domains were created with the intention of highlighting higher levels of need, and to inform assessors of the type of housing intervention and additional support that may be most beneficial for a participant. Additionally, it was constructed to help inform service providers and Continuums of Care of the priority of services that should be assigned. The scoring system outlined by the VI-SPDAT for Single participants is as follows: 0-3 consist of No housing support, 4-7 is Rapid Re-Housing (RRH), 8+ is Permanent Supportive Housing (PSH). According to HUD, RRH is a form of permanent housing that provides rental assistance for both short-term (up to three months) and medium-term (4-24 months) durations, and supportive services to households experiencing homelessness (Housing and Urban Development, n.d.b). Those assigned PSH are regarded as the most vulnerable populations and meet required disability criteria as outlined by HUD. The PSH services include long-term rental assistance and supportive services. Supportive services within both RRH and PSH housing support categories can include food assistance, mental health services, transportation, employment assistance, childcare, education, etc (Housing and Urban Development, n.d.a). For BIPOC “Single” participants, early versions of the VI-SPDAT reflected inequitable assignments within these two prioritization categories, leading to subsequent tool versions to address these disparities (De Jong, n.d.).
The reliability and accurate prioritization of vulnerable populations was also found to be inconsistent due to variability in the VI-SPDAT’s administration within communities where it was utilized (Brown et al., 2018). Because the VI-SPDAT was created to be a widely applicable tool, many have cited that it falls short in meeting community specific needs, may not account for regional risk factors or issues, and can have questions irrelevant to participants (Bitfocus, 2021). New assessment tools that have been created, such as the Southern Nevada SATT and CHAT tools, made specific changes based on input from community members and stakeholders to identify areas of prioritization that would best aid their vulnerable homeless populations (Bitfocus, 2021).
Collectively, these findings suggest that equitable tool development would benefit from research that identifies specific community-based needs and examines how the VI-SPDAT currently falls short in equitable housing assignments within their region. Considering the previously highlighted historical racial inequities that continually shape homelessness, it is imperative for those designing future tools to understand the racial history and current inequities within their local landscape. CVHPI conducted the racial analysis discussed below to explore inequities reinforced by the VI-SPDAT within Fresno/Madera housing assignments for Single Participants and add to the literature for those seeking to conduct baseline analyses for tool dvelopment.
Racial Equity Analysis
In Fresno and Madera counties, the VI-SPDAT has been an important element utilized by the FMCoC to assess and match individuals with housing and support services based on their unique situation. However, in light of the previously mentioned shortcomings, OrgCode no longer supports the utilization of the VI-SPDAT and has requested Continuums of Care to develop suitable replacement assessments. In order to construct an equitable housing prioritization tool to replace the VI-SPDAT, CVHPI was contracted by FMCoC to create the CESMAT. This tool was specifically designed for Fresno and Madera counties and aims to equitably evaluate vulnerability among Black, Native, Indigenous, Latinx, Asian, Pacific Islander, other People of Color, and people of different sexual orientations and gender identities.
As part of a larger effort to tailor this tool to specific community needs, CVHPI conducted a race/ethnicity-based equity analysis. This was done to better understand how racial disparities in housing prioritization and service allocation affect local populations in Fresno and Madera counties.
Specifically, we sought to investigate two questions:
- Are there race based differences in housing assignments for participants of the VI-SPDAT for Singles?
- Are there race based differences in endorsements (saying “Yes”) to items on the VI-SPDAT for Singles?
Methods
Race/ethnicity data and individual responses to the VI-SPDAT for Singles were obtained from FMCoC’s Homeless Management Information System for 1,369 FMCoC clients administered the tool between February 2, 2023 and March 18, 2024.
To assess housing assignments and endorsements of VI-SPDAT items based on FMCoC clients’ race/ethnicity, several data transformation and analytic procedures were performed. Notably, the administration period for the obtained data reflects a policy change implemented in October 2023, where FMCoC permitted clients’ to disclose multiple race/ethnicity identifications, as their former policy solely permitted a single race/ethnic identity to be documented.
Given that clients provided racial/ethnic identification(s) with no predetermined response options, two approaches were adopted to examine race/ethnicity in this context. The first approach restructured clients’ self-reported race/ethnicity data to create a White and non-White identifier variable to distinguish “White alone” from “BIPOC” clients. The second approach used federally recognized race and ethnicity categories (i.e., American Indian, Alaska Native, or Indigenous alone, Asian or Asian American alone, Black or African American alone, Native Hawaiian or Pacific Islander alone, White alone, Hispanic or Latine alone), along with a “Multiracial” and “Other'' category. Here, “Multiracial” refers to individuals who identified themselves as being of two or more races/ethnicities, and “Other” refers to individuals who identified themselves in a specific category not explicitly recognized under federal guidelines. In using both approaches, subsequent analyses will identify baseline differences between White and non-White groups, while also disaggregating baseline patterns to unmask culturally specific differences in housing assignments or endorsements.
Using the transformed data, two Chi-Square Test of Independence analyses were run to determine the association between recommended housing assignments and each race/ethnicity categorization method. Additionally, a least ordinary squares regression was performed for all items with a “Yes” or “No” response option on the VI-SPDAT for Singles. This analysis used White alone FMCOC clients as the reference category for each race/ethnicity categorization method to understand race/ethnicity-based endorsements. Supplemental analyses of remaining VI-SPDAT items were descriptively analyzed using frequency analyses. Data defined as “other”, “refused”, or “missing” remained part of these analyses.
Results
Recommended Housing Intervention
Within FMCoC, BIPOC and White alone clients consist of 71% and 29% of the data, respectively. Despite BIPOCs making up the majority of the sample, Figure 1 shows how BIPOCs were overrepresented in the rapid rehousing category, as the percentage difference between rapid rehousing to permanent supportive housing among BIPOCS were greater than White clients.
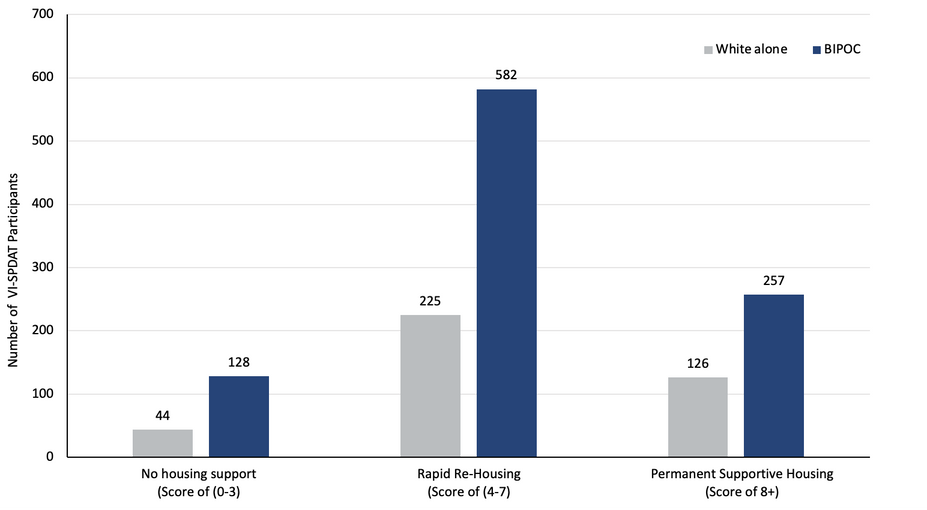
| Housing assignment | White alone | BIPOC |
|---|---|---|
| No housing support (Score of 0-3) | 44 | 128 |
| Rapid Re-Housing (Score of 4-7) | 225 | 582 |
| Permanent Supportive Housing (Score of 8+) | 126 | 257 |
Note. X2 (6) = 5.2, p = .52.
When reanalyzing recommended housing interventions using federal categories, the racial/ethnic composition was as follows: 41% Multiracial, 29% White, 17% Black or African American alone, 8% Hispanic or Latine alone, 3% American Indian, Alaska Native, or Indigenous alone, 2% Asian or Asian American alone, .07% Native Hawaiian or Pacific Islander alone, and .07% Other. As depicted in Figure 2, individual BIPOC groups remain overrepresented in the rapid rehousing category.
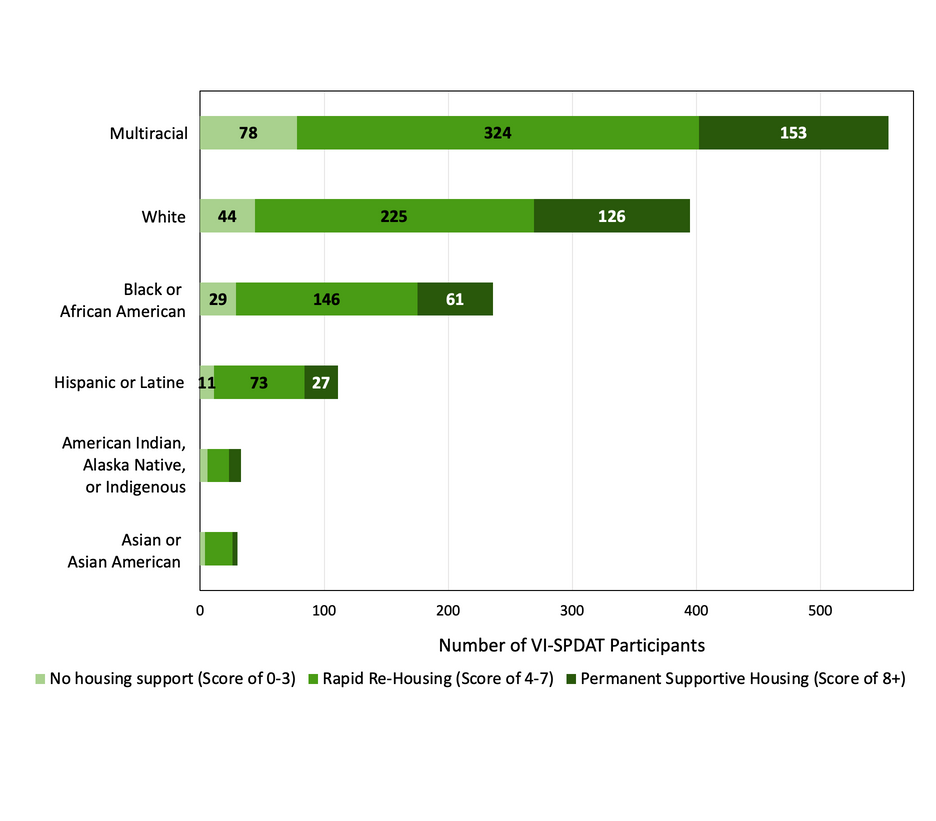
The chart groups recommended assignments into No housing support (Score of 0-3), Rapid Re-Housing (Score of 4-7), and Permanent Supportive Housing (Score of 8+) for each racial/ethnic category. Values printed in the chart are transcribed below.
| Race/ethnicity | No housing support | Rapid Re-Housing | Permanent Supportive Housing |
|---|---|---|---|
| Multiracial | 78 | 324 | 153 |
| White | 44 | 225 | 126 |
| Black or African American | 29 | 146 | 61 |
| Hispanic or Latine | 11 | 73 | 27 |
| American Indian, Alaska Native, or Indigenous | Not labeled | Not labeled | Not labeled |
| Asian or Asian American | Not labeled | Not labeled | Not labeled |
Note. X2 (18) = 17.38, p = .5. Native Hawaiian or Pacific Islander and Other identifying individuals were not depicted due to these groups making up less than 2% of the data.
VI-SPDAT Endorsement
The VI-SPDAT for Singles begins with the History of Housing and Homelessness domain to assess the sleep location, duration of homelessness, and number of homelessness episodes experienced by respondents. Within Fresno and Madera counties, 66% of FMCoC clients reported sleeping in a shelter, 70% reported that it had been a year or more since living in permanent housing, and 90% experienced up to three homelessness episodes within the past 3 years.
Following these items is the Risk domain, containing a mixture of frequency and binary response items gauging risky behaviors or placement in risky situations. Analyses revealed that within the past six months, 51% of FMCoC clients received healthcare at an emergency department/room. In addition, 36% used an ambulance to go to a hospital, 27% have been hospitalized as an inpatient, 20% used a crisis service, 40% had one or more instances of talking to police, and 14% stayed one or more nights in a holding cell. For the remaining binary items in this domain, unstandardized betas calculated from running ordinary least squares regressions showed that when compared to their White counterparts, BIPOC clients were less likely to endorse “Yes” to risk items (e.g., at risk of harm or exploitation). Therefore suggesting that FMCoC BIPOC clients are more likely to respond with “No” (see Figure 3).
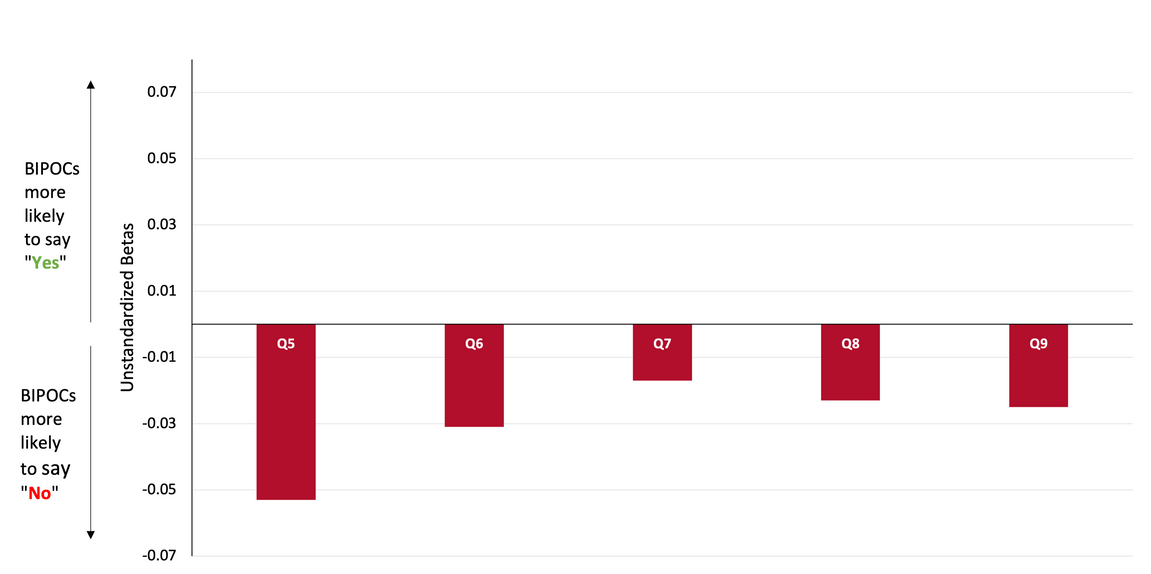
Unstandardized betas are below zero for each of the five Risk questions shown (Q5, Q6, Q7, Q8, and Q9), indicating lower endorsement relative to White-alone clients. The vertical scale runs from -0.07 to 0.07. Exact bar values are not printed on the original chart.
| VI-SPDAT question | Direction of BIPOC endorsement relative to White alone |
|---|---|
| Q5 | Negative unstandardized beta |
| Q6 | Negative unstandardized beta |
| Q7 | Negative unstandardized beta |
| Q8 | Negative unstandardized beta |
| Q9 | Negative unstandardized beta |
The Socialization and Daily Functioning section within the VI-SPDAT for Singles aims to capture financial and personal support needs. Within this domain, BIPOCs were more likely to endorse “Yes” to a majority of these items when compared to White alone clients (e.g., able to meet basic needs). However, for two of the five items in this section, clients alternatively responded with “No” or equal rates of endorsement were observed (i.e., owes creditors, any stream of income; see Figure 4).
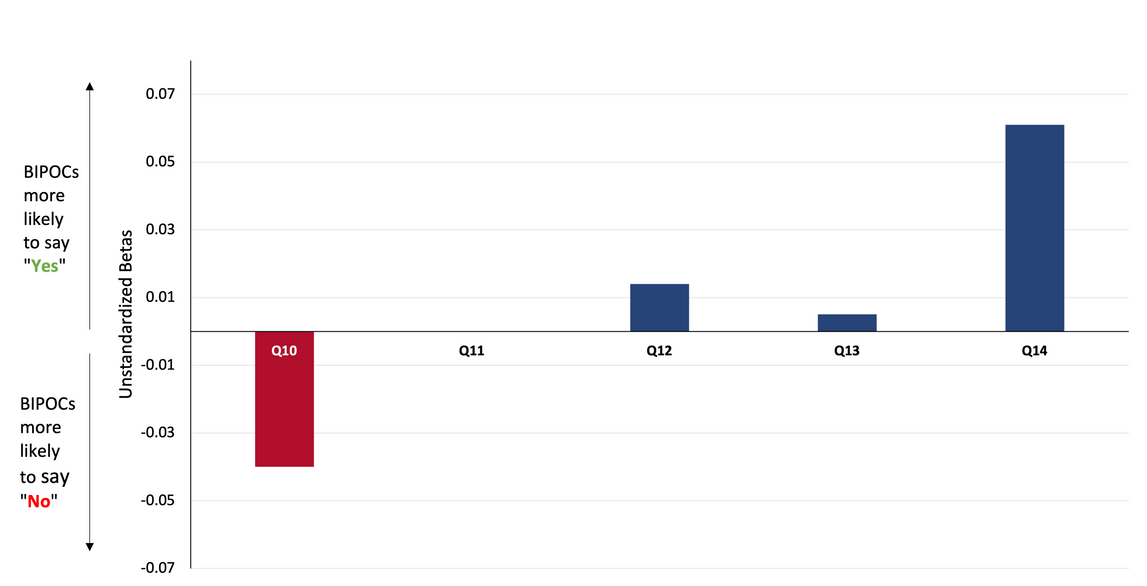
Unstandardized beta is negative for Q10, approximately zero for Q11, and positive for Q12, Q13, and Q14. The chart scale is from -0.07 to 0.07; exact bar values are not printed in the original.
| VI-SPDAT question | Charted direction |
|---|---|
| Q10 | Negative |
| Q11 | Near zero |
| Q12 | Positive |
| Q13 | Positive |
| Q14 | Positive |
The final domain refers to the Wellness section, where a majority of BIPOCs were more likely to respond “No” to wellness related items (e.g., substance use, mental health issues, experiences with abuse and trauma). Compared to White FMCoC clients, there were few instances of a greater likelihood to endorse items with “Yes” or for equal endorsement rates to occur (e.g., medication compliance; see Figure 5).
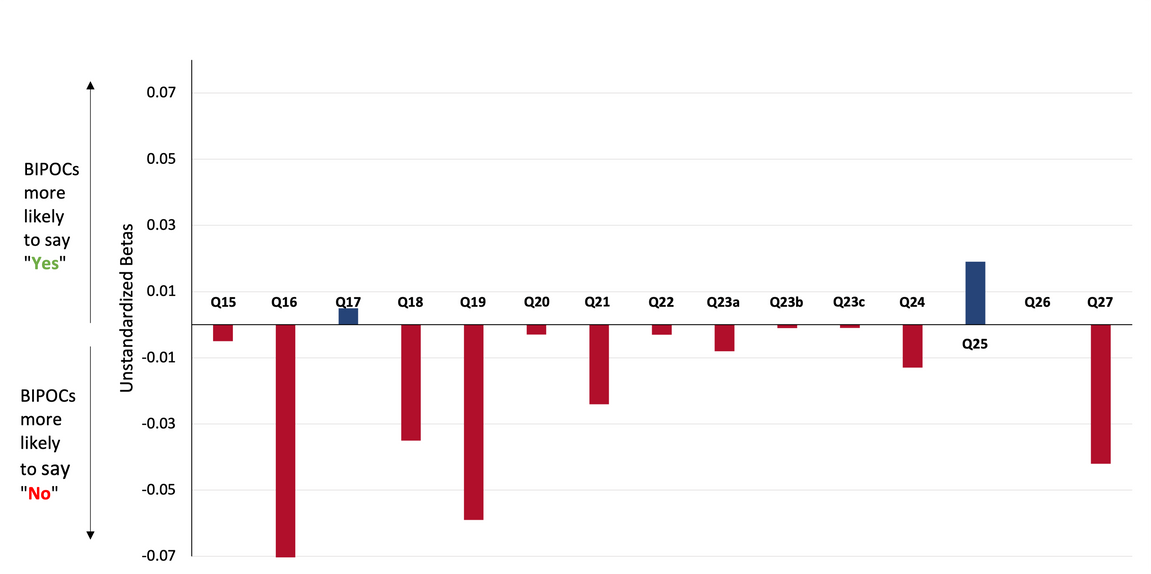
The chart displays unstandardized betas for Q15 through Q27, with separate Q23a, Q23b, and Q23c items. Most bars fall below zero. Q17 and Q25 are positive; Q26 is approximately zero. Values are not individually printed on the original chart; the vertical scale ranges from -0.07 to 0.07.
| Question | Charted direction |
|---|---|
| Q15 | Negative |
| Q16 | Negative |
| Q17 | Positive |
| Q18 | Negative |
| Q19 | Negative |
| Q20 | Negative |
| Q21 | Negative |
| Q22 | Negative |
| Q23a | Negative |
| Q23b | Negative |
| Q23c | Negative |
| Q24 | Negative |
| Q25 | Positive |
| Q26 | Near zero |
| Q27 | Negative |
Given that BIPOC individuals responded “No” to a majority of binary questions on the VI-SPDAT for Singles, the resulting unstandardized betas were averaged across all race/ethnic groups to assess the endorsement trend of each BIPOC group. Figure 6 shows that a majority of race/ethnic groups belonging to the BIPOC category were more likely to respond “No” to items across all VI-SPDAT domains.
Altogether, these findings demonstrate that within Fresno and Madera counties, BIPOC clients are more likely to respond “No” to a majority of questions and sections on the VI-SPDAT for Singles compared to White clients. Thus, as FMCoC moves away from the VI-SPDAT and towards the creation of the CESMAT as a racially equitable tool, question design and phrasing to assess homelessness vulnerability should be given greater emphasis to avoid deprioritization of BIPOC clients on the CESMAT.
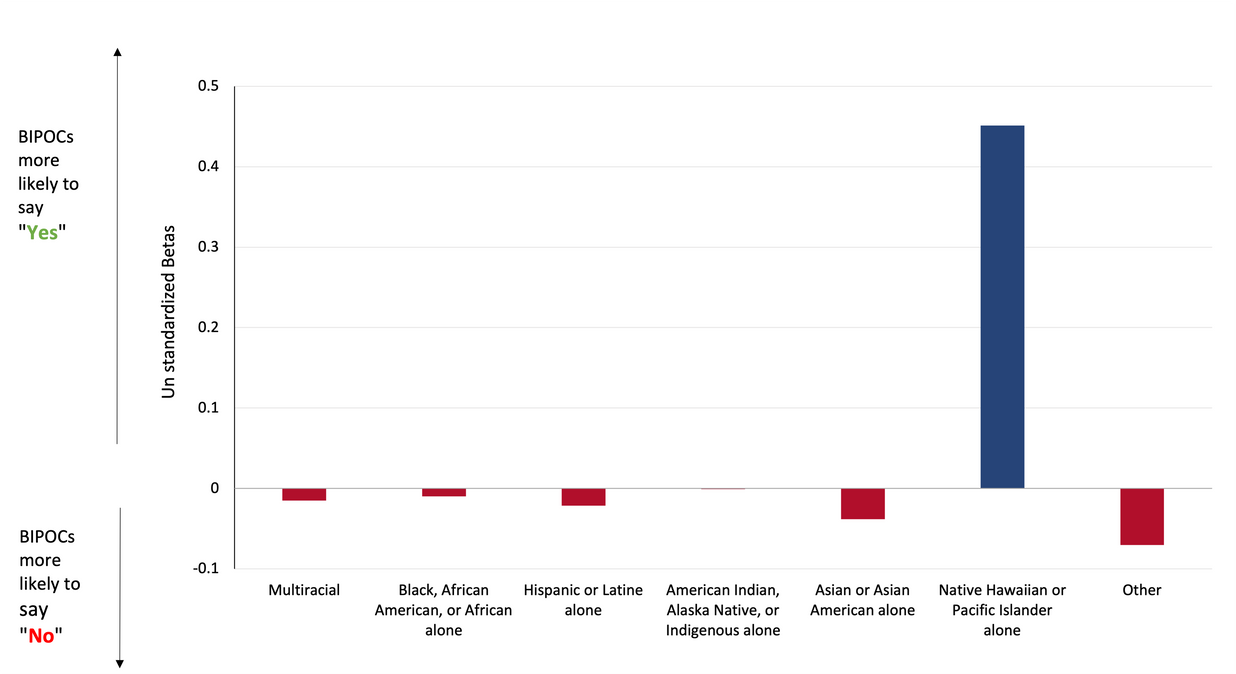
The chart displays unstandardized betas for Multiracial, Black/African American/African alone, Hispanic or Latine alone, American Indian/Alaska Native/Indigenous alone, Asian or Asian American alone, Native Hawaiian or Pacific Islander alone, and Other. Most groups have small negative betas; Native Hawaiian or Pacific Islander alone has a comparatively large positive beta. The vertical scale ranges from -0.1 to 0.5. Exact beta values are not labeled.
| Race/ethnicity | Charted direction |
|---|---|
| Multiracial | Negative |
| Black, African American, or African alone | Negative |
| Hispanic or Latine alone | Negative |
| American Indian, Alaska Native, or Indigenous alone | Near zero |
| Asian or Asian American alone | Negative |
| Native Hawaiian or Pacific Islander alone | Positive |
| Other | Negative |
Discussion
Significance of Race/Ethnicity Analysis
This analysis demonstrates how VI-SPDAT questions within domains such as Risk, Socialization and Daily Functioning, and Wellness can contribute to the deprioritizing BIPOC populations in Fresno and Madera. This in part can be attributed to how questions are phrased, as many of the questions of the VI-SPDAT are considered invasive and insensitive to participants, and can result in a hesitation to disclose personal information and a lower overall score (Aquino et al., 2022). The VI-SPDAT measures higher vulnerability by assigning a higher score to those with a higher rate of answering questions “Yes”. As such, the questions highlighted by this analysis directly contribute to deprioritization through lower score assignment. This may give an inaccurate assessment of a participant’s vulnerability and has potentially negative consequences on vulnerable BIPOC communities in Fresno and Madera counties.
Within the Risk Section, many of the questions are focused on identifying “risky behavior," which can be perceived as placing blame on the participant. Previous research has highlighted that BIPOC populations are more reluctant to disclose risky behavior than White counterparts, resulting in their lower scores (Cronley, 2020). This can be due to a lack of trust and comfort with survey administrators (differing race, lack of rapport or relationship, etc.), mistrust of how the information will be used, and any potential or perceived discrimination if this information is disclosed. Furthermore, the VI-SPDAT omits the harmful and compounded effects that discrimination and racism can have on BIPOC clients, especially within the housing sector (Aquino et al., 2022). In failing to account for historic racism and high rates of distrust among BIPOC communities’, the VI-SPDAT does not accurately capture vulnerability. Another important aspect of note is that assessments such as the VI-SPDAT favor White communities’ experiences throughout their development by relying on and centering primarily White samples. As such, BIPOC culturally specific vulnerabilities and risks are erased due to being viewed through a White cultural lens that often omits complexity and necessary cultural nuance in exchange for numerical results within housing prioritization (Nnawulezi & Young, 2021). In terms of risk behaviors, racial and socioeconomic discrimination significantly contribute to increased participation in risky behaviors, especially for Black populations, due to increased levels of stress and strain on mental health (Xie et al., 2020). In combining findings that BIPOC populations are less likely to disclose risky behavior and yet show higher levels of stress and vulnerability due to experiencing racism, we can see that historical context is essential in shaping equitable assessment questions.
Within the domains of Socialization and Daily Functions, and Wellness, this theme continues. Both sections have been shown to demonstrate poor validity and reliability in attempting to measure vulnerability, and previous research suggests that future tools may benefit from removing these questions (Shinn & Richard, 2022). This is directly related to the criticism that the VI-SPDAT lacks a trauma informed approach, both in its questions and administration. As such, the VI-SPDAT also neglects the fact that historical trauma increases the likelihood of homelessness, so the tool does not reliably weigh the impact of trauma on an individual's experiences navigating homelessness (Aquino et al., 2022). Additionally, relating VI-SPDAR questions to how trauma can be a result of historical and systemic racism, many of the questions within these sections inquire about mental health issues, physical disabilities or abuse. Through its deficit-based questions, many participants feel as if they have to "trade trauma for resources'' and that the responses on the assessment itself do not match their lived experiences (Aquino et al., 2022). Moreover, potentially invasive questions that clients consistently answer “No” to can mask the effects that trauma may be having on BIPOC individuals due to the mistrust of systems of support because of systemic barriers and historical racism.
Furthermore, in asking about health-related conditions and usage of medications within the Wellness domain, the VI-SPDAT attempts to gather information about increased vulnerability as a result of limited healthcare access. However, it is done in a way that places more emphasis on personal shortcomings rather than systemic barriers or focusing on the need present. For BIPOC populations, it is important to contextualize the complexities that come with healthcare access, disability diagnosis, and medication management. Historically, medical racism has barred BIPOC communities from receiving quality medical care, increased disparity in equitable health outcomes, and generated reasonable mistrust due to abuse. The results of these actions are longstanding and have a continuous negative effect on BIPOC populations, especially those who are experiencing homelessness (National Alliance to End Homelessness, 2023). For example, BIPOC individuals are far more likely to lack health insurance compared to White counterparts and are disproportionately affected by gaps in Medicaid (National Alliance to End Homelessness, 2023). Additionally, sheltered and unsheltered homeless populations experience adverse health outcomes such as exposure to communicable diseases, harmful weather conditions, violence, drug use, and malnutrition (Lee, 2021). But for BIPOC populations, additional barriers in terms of healthcare costs, transportation, and lack of resources exacerbate the adverse health outcomes experienced and limit their ability to receive preventative care or a diagnosis. Previous questions on the VI-SPDAT focus on diagnosis disclosure for mental or physical conditions and disabilities, which result in BIPOC populations answering “No” to these questions due to mistrust or lack of access to healthcare. To more accurately capture the challenges that these participants may be facing, assessment questions should focus on the services needed rather than a scenario, condition or physical limitation. This allows participants to discuss their needs without placing emphasis on a perceived deficit.
Within communities like Fresno and Madera who are shaped by historical history within housing, it is essential to account for the racist legacies continually affecting our BIPOC populations within the housing sector and leading to their deprioritization. Within our community landscape predominantly consisting of BIPOC individuals, it is especially imperative to close this racial inequity gap by looking at new ways to assess vulnerability and need level.
CESMAT Equity Approach
The Coordinated Entry System Matching Assessment ToolCESMAT development process and this analysis demonstrates that single BIPOC participants may be inequitably deprioritized in housing assignments as a result of VI-SPDAT utilization. Subsequent discussions between CVHPI and FMCoC highlighted the need for more intentional and equitable processes when seeking and being assigned housing services. The CESMAT reflects these efforts to increase equity by creating two separate assessment sections - one targeted at measuring vulnerability and the other targeting acuity level. Within each section, assessment questions are carefully constructed to identify areas of needed support that systemically and historically have presented barriers for our BIPOC populations (e.g., healthcare access, food and quality of living needs, employment, housing discrimination and barriers, etc). In contrast, the VI-SPDAT has designed vulnerability scores to measure a person’s deficiencies or shortcomings, excluding the complexities that arise when navigating homelessness. As a result, participants can be considered lower vulnerability but have high acuity needs that remain unmet due to a lower score and are at higher risk of service re-entry. By moving past the deficit model and incorporating acuity, the CESMAT attempts to better capture cultural nuance by creating questions that target areas where BIPOC populations face systemic barriers and focus on the need present.
Measuring acuity accounts for the consequences that racism and discrimination have had on BIPOC communities’ overall health, access to adequate housing and supportive social services, housing history and ability to maintain housing, and upward mobility. The overall goal of this racial equity framework is to capture both the presence and severity of unmet needs, and which supportive services are necessary to help individuals overcome barriers contributing to sustained homelessness.
Vulnerability vs. Acuity
To create a more responsive tool, CVHPI and FMCoC explored an area where the VI-SPDAT falls short - intentionally understanding the differences in vulnerability and acuity when assigning housing services; and using this distinction to curate questions to capture one’s housing situation and any outstanding barriers. By expanding vulnerability and acuity to incorporate a racial perspective, we hope to reduce the many unfair and preventable inequities discussed previously.
According to HUD, vulnerability refers to the lack of needs being met, the number of needs not being met, and the harm a household faces if housing needs continue to be unmet (Woolfolk, n.d.). The core of measuring vulnerability is to “triage housing decisions for individuals experiencing homelessness” (Cronely, to help guide decisions on who would best be supported by each housing category based on HUD and housing provider criteria. Measurable indicators include age, illnesses and disability, exposure to violence or life-threatening events, length of time experiencing homelessness, and frequency of hospitalizations.
In contrast, acuity refers to the level of supportive services an individual requires in order to meet their needs and keep these needs met (Woolfolk, n.d.). Acuity can also be referred to as “an assessment of the level of complexity of a person’s experiences”, as it includes an intersectional lens on systemic barriers and risk factors that may be affecting someone’s ability to maintain housing, and helps in capturing the wide variety of circumstances surrounding one’s homelessness (Calgary Homeless Foundation, 2014). Acuity level can fluctuate at different points of time, and housing insecurity can continue while a client is housed due to outstanding barriers. Measurable indicators include serious and chronic illness, poor cognitive functioning, trouble completing activities of daily living, history of trauma, lack of natural support, and history of homelessness.
Capturing Vulnerability vs. Acuity in Assessment Phrasing
The goal of CESMAT vulnerability based questions is to help match clients to the housing support option based on their needs. It also attempts to measure any harm that a person may incur if housing needs remain unmet. For example, questions that fall within this category may deal with: homelessness duration or current residency location, development of adverse physical or mental symptoms during the current homeless episode, ability to seek healthcare or meet any health related needs, and any harm currently experienced (e.g., domestic violence).
Vulnerability
An example of attempting to curate questions with a racial equity lens is within the CESMAT domain of housing history. Referencing Figure 7, we have expanded upon the previous VI-SPDAT categories of housing (shelters, transitional housing, safe haven, outdoors, other) to incorporate a wider range of potential dwellings and capture participants who many experience “hidden homelessness” or situations where they are residing in unstable provisional housing conditions. However, they are unable to secure permanent housing on their own (Homeless Hub, n.d.). Within our own racial analysis, a large portion of our population is currently residing within a shelter, vehicle or on the street. This suggests increased risk to harm and vulnerability that must be captured and prioritized due to less stable housing conditions. From a racial equity and cultural competency perspective, expanding housing categories allows for increased nuance when capturing vulnerability. It allows for a wider variety of housing circumstances that better reflect participants' cultural and financial situations.
Another instance of directly measuring outstanding variables contributing to increased vulnerability are within the CESMAT wellbeing domain. In Figure 8, rather than asking deficit based questions that ask for diagnostic chronic health conditions or disability disclosure, or ask if participants “avoid getting help” when ill, CESMAT questions are designed to focus on interactions with the healthcare system and level of access. When asking about new or continuing health issues that may have worsened, we directly attempt to capture if any physical health-related harm has occurred. Additionally, through asking about insurance or if they have access to primary preventative care, the CESMAT addresses healthcare barriers that burden BIPOC populations and allows for the prioritization of those who need access to these services. Figure 8. Measuring Vulnerability and Physical Wellbeing within the CESMAT
| 1. Where did you sleep last night? | |
|---|---|
| ☐ I slept in a transitional shelter, emergency safe house/shelter, or bridge | |
| ☐ I slept in a Hotel that I paid for | |
| ☐ I slept in a Hotel that an agency paid for | |
| ☐ I slept outside on the street | |
| ☐ I slept in substandard housing (in conditions that may endanger the life, limb, property, safety, or welfare of the occupants or the general public) | |
| ☐ I slept in a car or RV not connected to utility services | |
| ☐ I slept in an abandoned building | |
| ☐ I slept at a bus or train station | |
| ☐ I slept at a park | |
| Physical well-being | |
|---|---|
| 3. Have you developed or have you had any previous health issues that you have not been able to receive care for or that have worsened during your current period of homelessness? | Y / N |
| Score: / | |
| 4. Do you have a personal or family doctor or other health care professional, such as a nurse, that you usually rely on if you need medical care? | Y / N |
| Score: / | |
| 5. Do you have health insurance? | Y / N |
| Score: / | |
Acuity
Capturing acuity through assessment questions helps distinguish additional supportive services that are needed to help maintain housing, but also any assistance with activities of daily living that are necessary to sustain quality of life. These can include mobility and transportation needs, hygiene, communication, medication management, financial assistance, etc. Acuity questions focus on challenges such as past episodes of homelessness, factors that have contributed to current or past homelessness (domestic violence, unstable home life, discrimination, etc.), employment and financial barriers, and experiences concerning mental health challenges, trauma, or substance use.
Acuity questions, such as those focusing on accessing basic needs and social supports (Figure 9), help assessors and Continuums of Care identify areas of needed supportive services and potential barriers to maintaining long-term housing. For example, being unable to access a shower, food or water, or clothing when needed not only suggest a higher level of need. If left unaddressed, these aspects can contribute to difficulty finding employment or adverse health conditions over the long term. Thus, questions inquiring about taking care of basic needs can help service and housing providers determine areas of needed support to help participants maintain stable housing.
Expanding on the access to healthcare questions in the vulnerability section of the CESMAT, asking additional questions within the acuity section allows for different perspectives and barriers to be more accurately captured (Figure 10). For example, additionally asking about the comfort participants have with their doctor, along with inquiring about their access to primary care, helps address the racial disparities mentioned earlier. It captures and prioritizes those who may feel uncomfortable with medical institutions and their need for additional health-related resources, or those at greater risk of adverse health conditions due to lack of preventative care. Similarly, by asking if medical expenses have been a financial burden, the CESMAT incorporates additional nuance to medically related financial barriers, regardless of whether the person has insurance. Incorporating questions such as this address the earlier disparities bypassed on the VI-SPDAT and captures a more holistic and racially equitable narrative of the participant’s lived experience.
If the client responds “Yes,” then score
| 12. Most days can you: | |
|---|---|
| ☐ Find a safe place to sleep | |
| ☐ Access a bathroom when you need it | |
| ☐ Access a shower when you need it | |
| ☐ Get food | |
| ☐ Get water or other non-alcoholic beverages to stay hydrated | |
| ☐ Get clothing or access laundry when you need it | |
| ☐ Safely store your stuff | |
| Score: / | |
| 13. Do you have difficulty taking care of basic needs like bathing, changing clothes, using a restroom, and eating independently? | Y / N |
| Score: / | |
| 14. If, for any reason, you need help with day-to-day activities such as bathing, preparing meals, shopping, managing finances, etc., do you get the help you need? | Y / N |
| Score: / | |
| Access to Healthcare Services | |
|---|---|
| 10. Have you recently been unable to pay for or access prescribed medications or medical expenses (ex: care, prescriptions, mental, physical, vision, or dental)? | |
| Score: / | |
| 11. Do you feel comfortable connecting with your doctor to discuss your health concerns? | Y / N |
| Score: / | |
Recommendations
The Central Valley Health Policy Institute’s racial equity analysis in consultation with FMCoC revealed how BIPOC populations within Fresno and Madera counties are overrepresented in less supportive housing assignments and maintain lower endorsement trends for items on the VI-SPDAT for Singles. Given these results, we recommend that Continuums of Care who are in the process of developing a replacement for the VI-SPDAT consider the following suggestions as they move forward in reconfiguring their housing matching process:
Understand where equity lacks.
In the present context, racial equity was at the forefront of our analysis. However, given historical and contextual issues facing a region a Continuum of Care serves, other factors may be considered for additional understanding of how the VI-SPDAT may fall short within a local context. For each individual community, it is essential to explore questions such as, “Who is overrepresented and underrepresented in your homeless response system?,” “How is our homeless response serving our community, is it effective and equitable?“(Osawe & Beers, 2024). Further, seek to understand how the VI-SPDAT or other utilized housing assessments may be contributing to any observed disparities.
Expand efforts toward other VI-SPDAT versions.
Our analysis gave insight into the VI-SPDAT for Singles, not for the Transitional Aged Youth or Family versions of the VI-SPDAT. Thus, Continuums of Care with high rates of VI-SPDAT administration for young and family participants would benefit from understanding how questions on additional versions of the VI-SPDAT are endorsed and contribute to housing assignments or potential disparities within vulnerable families and transitional aged youth participants.
Involve individuals with lived experience.
As part of the development of the CESMAT, both FMCoC community stakeholders and individuals with lived experience held critical insights to understand experiencing and escaping homelessness. Individuals at risk of, currently experiencing, or formerly homeless can provide a wide range of invaluable feedback including how question phrasing is being received and setting community priorities. Including such voices allows Continuum of Care and service providers to directly create assessment and homeless response solutions that address specific disparities in your community, and is necessary to further center equity within housing assignments (Osawe & Beers, 2024).
Outline how a housing matching tool will be used within a Continuum of Care.
Depending on the Continuum of Care, the VI-SPDAT or another utilized assessment may have been used to supplement or determine decisions for housing assignments. Understanding that the VI-SPDAT is a decision assistance tool with broad applicability, Continuums of Care should be aware of how a housing matching assessment will influence and be placed within a coordinated entry system. Having a solid foundation of how each provider within a CoC utilizes the assessment allows for analysis into how the assessment may be contributing to inequities within housing provisions, and provide insight into CoC specific solutions to increase equity (Mitchell & Field, n.d.).
Clarify what new housing matching tools should measure.
Based on this analysis, coupled with prior literature and discussions with FMCoC stakeholders, measuring acuity and vulnerability separately is the future for housing assessments at FMCOC. Although this approach is unseen in other redevelopments of housing matching processes, removing or adding features to existing housing matching tools should always go back to addressing homelessness at the local level.
Incorporate supplemental resources to enhance a housing match tool.
As a response to the shortcomings of the VI-SPDAT, CVHPI created a training and script for the administration of the CESMAT to ensure administrators adopt a uniform approach that is consistent across the entire Continuum of Care. This and similar additions can help further the support a Continuum of Care can offer, reduce assessor bias, provide equitable care, and reduce re-traumatization for participants (Osawe & Beers, 2024).
Summary
The Central Valley is home to a rich diverse community, many of whom have been unfairly subjected to racism, inequity and trauma throughout the history of Fresno and Madera regions. By presenting our analysis through this lens, we can better understand the systemic barriers that contribute to BIPOC overrepresentation within housing services and the many challenges that can negatively impact how those in our community navigate homelessness. Intentionally applying this historical context was critical in drafting new assessment questions that go beyond the previously utilized VI-SPDAT. The CESMAT tool considers local community barriers and lived experiences, and captures the level of need and vulnerability in a trauma-informed and culturally appropriate way. Through this racial equity analysis, CVHPI and FMCoC have made a conscious effort to center racial equity throughout the creation of the CESMAT administration tool.
References
-
Acosta, S., & Gartland, E. (2021, July 22). Families wait years for housing vouchers due to inadequate funding. Center on Budget and Policy Priorities. https://www.cbpp.org/research/housing/families-wait-years-for-housing-vouchers-due-to-inadequate-funding
-
Aquino, C., Peterson, M., Rennie, S. P., Moore, M., Edel, J., & Stiles, E. (2022). Examining equity in housing: An analysis of the inefficiencies and inequities of VI-SPDAT & predictive modeling as resource prioritization screening tools, and data based recommendations for increasing effectiveness through trauma informed & client centered practices. Michigan Coalition to End Domestic and Sexual Violence. https://mcedsv.org/wp-content/uploads/2022/08/Examining-Equity-in-Housing-An-Analysis-of-the-VI-SPDAT-with-recommendations-for-Trauma-Informed-Client-Centered-Prioritization-edit-20220806b-1.pdf
-
Bitfocus. (2021, June 4). Going beyond the VI-SPDAT: Developing a new assessment. https://www.bitfocus.com/blog/going-beyond-the-vi-spdat-developing-a-new-assessment
-
Brown, M., Cummings, C., Lyons, J., Carrión, A., & Watson, D. P. (2018). Reliability and validity of the Vulnerability Index-Service Prioritization Decision Assistance Tool (VI-SPDAT) in real-world implementation. Journal of Social Distress and Homelessness, 27(2), 110–117. https://doi.org/10.1080/10530789.2018.1482991
-
Calgary Homeless Foundation. (2014). System planning framework. https://www.homelesshub.ca/sites/default/files/CHF%20System%20Planning%20Framework.pdf
-
California Health Care Foundation. (2009). Fresno: Poor economy, poor health stress an already fragmented system. https://www.chcf.org/wp-content/uploads/2017/12/PDF-AlmanacRegMktBriefFresno09.pdf
-
California Health Care Foundation. (2009). Fresno: Poor economy, poor health stress an already fragmented system. https://www.chcf.org/wp-content/uploads/2017/12/PDF-AlmanacRegMktBriefFresno09.pdf
-
California Housing Partnership. (2024). Fresno County 2024: Affordable housing needs report. https://chpc.net/wp-content/uploads/2024/05/Fresno_Housing_Report.pdf
-
Central Valley Health Policy Institute. (2021). Invest in southwest. https://chhs.fresnostate.edu/cvhpi/documents/INVEST%20IN%20SOUTHWEST%20-%20FINAL%209.4.2021.pdf
-
Cronley, C. (2020). Invisible intersectionality in measuring vulnerability among individuals experiencing homelessness – critically appraising the VI-SPDAT, Journal of Social Distress and Homelessness, 31(1), 22-33. https://doi.org/10.1080/10530789.2020.1852502
-
De Jong, I. (n.d.). A message from OrdCode on the VI-SPDAT moving forward. OrdCode. https://www.orgcode.com/blog/a-message-from-orgcode-on-the-vi-spdat-moving-forward
-
Fresno Economic Opportunities Commission. (2022, November 13) Strategic planning - Poverty in Fresno County. https://fresnoeoc.org/strategic-planning-poverty-in-fresno-county/#:~:text=20.6%25%20of%20the%20residents%20experience,of%20living%20in%20Fresno%20County
-
Fresno-Madera Continuum of Care. (n.d.). 2023 Point-in-time count executive summary. https://static1.squarespace.com/static/5cc7bc02e8ba44aa938ccd4f/t/64c08bea331c692482c94061/1690340330958/2023+PIT+Executive+Summary.pdf
-
Homeless Hub. (n.d.). About homelessness. https://www.homelesshub.ca/about-homelessness/population-specific/hidden-homelessness
-
Housing and Urban Development. (n.d.). Permanent supportive housing (PSH). https://www.hudexchange.info/
-
Housing and Urban Development. (n.d.). Supportive services. https://www.hudexchange.info/homelessness-assistance/coc-esg-virtual-binders/coc-eligible-activities/supportive-services/
-
ICF (2023). Toolkit of best practices to advance racial equity [Presentation slides]. Housing and Community Development California. https://www.hcd.ca.gov/sites/default/files/docs/grants-and-funding/esg/hcd-california-racial-equity-toolkit.pdf
-
Kaiser Permanente Fresno Medical Center. (2022). 2022 community health needs assessment. https://about.kaiserpermanente.org/content/dam/kp/mykp/documents/reports/community-health/fresno-chna-2022.pdf
-
Lee, A. (2021, January 22). Disparities in health care for the homeless. Loma Linda Health University. https://ihpl.llu.edu/blog/disparities-health-care-homeless
-
McCauley, H. L., & Reid, T. (2020). Assessing vulnerability, prioritizing risk: The limitations of the VI-SPDAT for survivors of domestic & sexual violence. Michigan State University. https://safehousingpartnerships.org/sites/default/files/2020-08/CE_McCauleyReid_FINAL.pdf
-
Mitchell, M., & Field, J. (n.d.). Prioitization & assessment [Presentation slides]. California Department of Housing & Community Development. https://drive.google.com/file/d/1d9uVGBC_b-lTT2kPj1QkeBTuMulHbdOs/view
-
National Alliance to End Homelessness (2023, December). Homelessness and racial disparities. https://endhomelessness.org/homelessness-in-america/what-causes-homelessness/inequality/#:~:text=Of%20the%20more%20than%20653%2C000,have%20more%20difficulty%20accessing%20treatment
-
Nnawulezi, N., & Young, L. (2021). Pitfalls of housing prioritization: Considerations of power and culture. Safe Housing Partnerships. https://safehousingpartnerships.org/sites/default/files/2021-04/CE_Paper_Pitfalls_of_Housing_Prioritization_0.pdf
-
Osawe, C. & Beers, E. (2024, May 28). Consistently centering equity. [Presentation slides]. California Department of & Housing Community Development. https://drive.google.com/file/d/1mRgsaQ77qhwDLSOrIkkOPOjdRea4Q3tG/view
-
Public Policy Institute of California. (2023). Crime rates increased in most state's 15 largest countries in 2022 [Infographic]. Ppic.org. https://www.ppic.org/publication/crime-trends-in-california/
-
Rowen, E., Hilton, B., & Douglass-Jaimes, G. (2020, December 3). The legacy of housing segregation. ArcGIS StoryMaps. https://storymaps.arcgis.com/stories/c25eb4c363a4483c97bc19710824c906
-
Shinn, M., & Richard, M. K. (2022). Allocating Homeless Services After the Withdrawal of the Vulnerability Index-Service Prioritization Decision Assistance Tool. American journal of public health, 112(3), 378–382. https://doi.org/10.2105/AJPH.2021.306628
-
State of California Business, Consumer Services and Housing Agency. (n.d.) People experiencing homelessness who California served [Infographic]. Bcsh.ca.gov. Retrieved June 18, 2024, from https://bcsh.ca.gov/calich/hdis.html
-
Thebault, R. (2018, August 20). Fresno's Mason Dixon line. The Atlantic. https://www.theatlantic.com/politics/archive/2018/08/fresnos-segregation/567299/
-
Wilkey, C., Donegan, R., Yampolskaya, S., & Cannon, R. (2019). Coordinated entry systems racial equity analysis of assessment data. C4 Innovations. https://c4innovates.com/wp-content/uploads/2019/10/CES_Racial_Equity-Analysis_Oct112019.pdf
-
Woolfolk, D. (n.d.). Strategies to support high acuity populations. [Presentation slides]. Housing and Urban Development. https://files.hudexchange.info/resources/documents/Strategies-to-Support-High-Acuity-Populations-Slides.pdf
-
Xie, T. H., Ahuja, M., McCutcheon, V. V., & Bucholz, K. K. (2020). Associations between racial and socioeconomic discrimination and risk behaviors among African-American adolescents and young adults: A latent class analysis. Social Psychiatry and Psychiatric Epidemiology, 55, 1479-1489. https://doi.org/10.1007/s00127-020-01884-y