Adolescent Health in the San Joaquin Valley: Individual and Neighborhood Characteristics
Individual and Neighborhood Characteristics

Health Equity for All


Central California Center for Health and Human Services
1625 East Shaw Avenue, Suite 146
Fresno, CA 93710-8106
Phone: 559.228.2150 Fax: 559.228.2168
www.cvhpi.org


Printed page III
ABSTRACT
Promoting healthy and appropriately timed pregnancies and births are key objectives for public health. This report examines reproductive health outcomes and determinants in the San Joaquin Valley (SJV), focusing on teen births and birth outcomes. The SJV counties has some of the highest rates of teen birth observed in the state of California, but they have seen dramatic reductions in teen birthing in recent years. During the study period, the proportion of preterm births (PTB) was greater within the SJV region, 9.4%, than the state, 8.8%. Overall, the SJV has higher rates of premature birth than the state. There was considerable variation by residence and other factors within the SJV, as well. Rates of both teen birthing and adverse birth outcomes were higher for low income women of color living in neighborhoods with fewer economic opportunities and higher pollution. The SJV Public Health Consortium identified three specific opportunities their members can champion at the county level to improve reproductive health in the region:
- Promoting healthy and appropriately timed pregnancies and births are key objectives for public health
- Provide individually oriented education, health promotion, screening and interventions for women of reproductive age to reduce risk factors for adverse outcomes
- Investigate and increase the responsiveness of policies and programs to social, economic and environmental factors that impact pregnancy and early childhood outcomes
Printed page 1
Introduction
Promoting healthy and appropriately timed pregnancies and births are key objectives for public health. Research indicates that early investments in reproductive health initiatives improve the health and well-being of all individuals.1, 2 While substantial achievements have been made over the last 100 years, progress has slowed in the United States and we are now behind many peer high-income nations in achieving key maternal and child health goals as outlined by the World Health Organization.3 Further, there is much variability in outcomes across the US and California. An evidence-based consensus has emerged that potentially modifiable individual factors and more difficult but still modifiable environmental and social exposures dramatically impact reproductive health outcomes. The importance of a comprehensive assessment of reproductive health outcomes and determinants in the San Joaquin Valley (SJV) is key to improving the health of young women and future generations of SJV residents.
Teen Child-Bearing
Because pregnancy and child-bearing by teenagers is associated with long term negative social, economic and health outcomes for the teen mother, her child and the larger society,4 reductions in teen pregnancy and births has been a major focus of public health initiatives. A growing number of studies have shown that children born to mothers younger than age 18 are at greater risk for adverse birth outcomes while there is less consensus on health challenges for teen mothers.5, 6 Teen parenting is also associated greater risk for postnatal depression, school dropout and adverse socioeconomic outcomes for the mother.7 Teen birth rates have declined steadily nationwide and by 2014 the rate was about 24 births/1000 adolescent females, which was almost 1/3 of the 1990 rate. Nonetheless, in 2013, adolescent mothers comprised 7.8% nationally and 7.0% in California of all births.8 There are also notable variations in teen child-bearing by race/ethnicity, social class, and place of residence nationally and in California: in an analysis of 2013 data, the California School-Based Health Alliance found that “……annually, for every 1,000 adolescent girls aged 15-19 living in California, there are 51 births to Latinas, 37 to African Americans, 12 to whites, and 9 to Asians.”9 Because of the high public and private costs associated with teen child-bearing and the reductions in these outcomes linked to prevention programs, teen pregnancy prevention programs are broadly viewed as cost-effective strategies. Despite reductions in teen pregnancy prevention investments by California during the 2007/2009 recession, new Federal and philanthropic investments in replicating evidence-based models and recent California legal mandates to provide comprehensive reproductive health education and confidential access to health care have broadened access to these programs.
Young Women’s Health
As more is understood of the causes of low-birth weight (LBW) and other poor pregnancy and birth outcomes, it is clear that a woman’s health prior to conception is largely responsible for the health of her pregnancy and her infant at birth. Promoting the health of women before and during pregnancy is multifaceted, especially when considering social and environmental contexts. Research and interventions need to focus attention on the overall health and social experience of young women. For women of child-bearing age, sexually transmitted infections (STIs), key co-morbidities (smoking, obesity, drug use, stress, diabetes, and hypertension) and decreased access to prenatal care are known to be key determinants of poor outcomes for women and babies. Of these risk factors, obesity is one of the most significant indicators of poor maternal and infant health outcomes, associated with elevated blood pressure, gestational diabetes, birth complications, cesarean deliveries and higher rates of complications from those deliveries including infections, hernias or life-threatening bleeding.10, 11, 12 In the SJV, 39% of women between the ages of 14-29 are overweight/obese, as compared to 32% of women in California.13
Additionally, contraception use and family planning counseling is critical for all women of reproductive age. Unintended pregnancy is associated with numerous adverse consequences, including delayed entry into prenatal care and an increased risk of harmful behaviors, especially among young women.14
Neonatal and Infant Health
For newborns, there are multiple measures of well-being that are complexly correlated. Adverse birth outcomes include LBW, pre-term birth (PTB), infant morbidity (failure to thrive and other diagnosed medical conditions) and infant mortality (birth - 1 year). Recent studies have pointed to PTB as a strong indicator of poor maternal and infant health and a helpful measure overall as it is associated with other poor infant health outcomes and long-term economic and social challenges for individuals and communities. One of the reasons that PTB is a good measure of women’s health is that the most vulnerable stage of fetal development occurs between the fourth and tenth week of gestation.15 PTB has been attributed to maternal age (both teen pregnancies and for mothers over 35), chronic health conditions like high blood pressure, diabetes and folic acid deficiency and high risk behaviors including drug and alcohol use. March of Dimes and other national groups have highlighted reducing PTB as a key measure of progress in addressing women’s reproductive health more generally. Regionally speaking, women who become pregnant in the SJV face a much higher risk of PTB compared to other regions within the state, particularly women of color and those who reside in low-income communities.
Ultimately, PTB is a “canary in the coal mine,” highlighting a health crisis facing women as a result of poor social, economic, environmental and overall health contexts. PTB has a cyclical impact on poverty for individuals and communities, with each birth costing over $50,000 on average, or $26.2 billion nationwide annually.16 This total is a low estimate of health care costs, labor and delivery costs, early intervention services, special education services and lost work and salary—all costs that will impact individuals, employers and communities alike.
Individuals, Neighborhoods and Health
A common set of individual and neighborhood factors have been linked to maternal and child health outcomes. Many of these same factors have been linked to teenage pregnancy and child-bearing.17, 18 Women with individual risk factors such as poverty, low education, challenging work, and racial/ethnic “minority” status face greater stresses before and during pregnancy, have less access to preventive care and pregnancy care, and have more adverse birth outcomes. Similarly, living in poor, segregated, conflict-filled and polluted neighborhoods seems to increase risk for adverse birth outcomes beyond the effect of individual factors. These stark differences are explored in research utilizing the life course perspective, a combination of early programming and cumulative pathway theories.
The life course perspective addresses the health outcomes throughout a person’s life as the result of complex relationships between biological, behavioral, psychological, environmental and social protective and risk factors. For example, traditionally, in an attempt to decrease the incidence of low infant birth weights, clinics, obstetricians, and public health organizations have focused on prenatal care for women as soon as pregnancy is discovered. Despite these efforts, PTB rates have ceased to significantly decline, and the disparities between the most and least vulnerable populations continue to rise.2 As more is understood about the causes of low-birth weight, it has become clear that a woman’s health and environment prior to conception, as discussed above, is largely responsible for the health of her pregnancy and her infant at birth.19 The life course perspective suggests that these disparities result from differences in protective and risk factors between groups of women over the course of their lives. As a result, the health, environment and socioeconomic status of one generation directly affects the health status of the next.
The life course perspective integrates critical periods and early life events with an emphasis on the wear and tear a person experiences through time. This approach considers the many levels of influence (adopted from the socio-ecological model: societal, community, relationship and individual)20 contributing to women’s health. For example, in the Figure 1 below, differences in risk factors (downward arrows) and protective factors (upward arrows) over one’s life course affect health and development and contribute to disparities in birth outcomes.21 The two pathways reflected in the figure are for white women as compared to African American women, populations with distinctly different health and birth outcomes. Reproductive potential addresses how one’s health status at any given age may influence reproductive health and future birth outcomes.
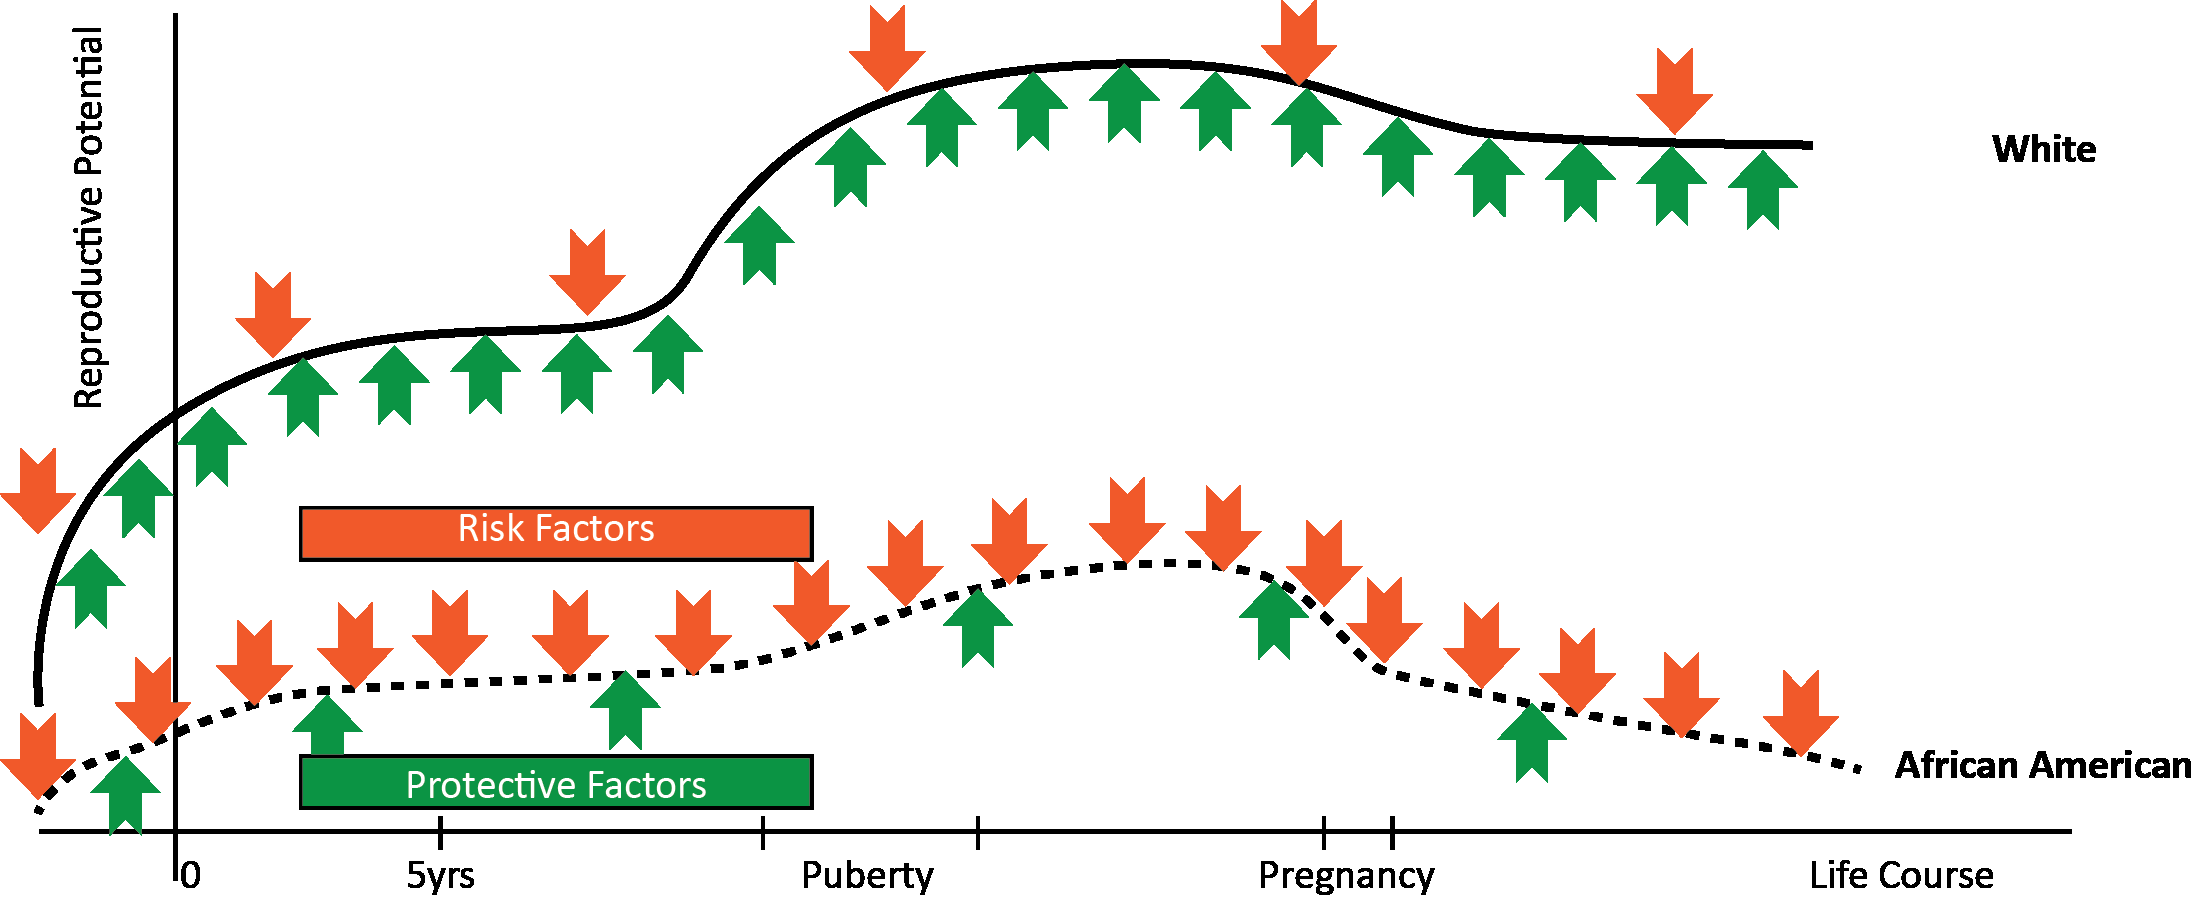
Diagram description: The vertical axis is “Reproductive Potential” and the horizontal axis is “Life Course,” with labels for 0, 5yrs, Puberty, and Pregnancy. The solid pathway labeled “White” lies above the dotted pathway labeled “African American.” Downward arrows represent Risk Factors; upward arrows represent Protective Factors. The White pathway shows more protective-factor arrows, while the African American pathway shows more risk-factor arrows. Both pathways rise during early life, change through puberty and pregnancy, and decline later. The diagram provides no numerical scale for reproductive potential.
The early programming mechanism22 presumes that early periods of life are sensitive developmental periods and that experiences and exposures that occur in this phase may permanently alter organ systems and other bodily functions, causing lasting and irreversible change. If these experiences and exposures are negative, a person may be relegated to poor health and disease throughout their life, particularly in regard to their own reproductive potential. The periods of time considered to be most influential are in utero and early childhood and can be affected by disease, poor health behaviors and stress.
The cumulative pathway mechanism23 indicates that “wear and tear” experienced throughout one’s life can become cumulative, or snowballing, in its effect on one’s health. This mechanism focuses primarily on the cumulative effects of stress and research invoking this principal has demonstrated that those who experience chronic stress can be adversely affected and experience negative reproductive health outcomes such as PTB. In the SJV, many factors contribute to chronic stress for young women, including high levels of pollution, less access to education and career development opportunities, less access to healthcare, and lack of social support. Analysis often “controls” for many of these influences but the lingering stress and poor health associated with these circumstances remains ever present when comparing racial sub-groups of women, as indicated in analyses present in this report.
Current SJVPHC Programs supporting the Health of Young Women
The link between the health of young women, neighborhood poverty, race/ethnicity and other factors has implications for San Joaquin Valley Public Health Consortium (SJVPHC) member local health departments because of their extensive programming centered on women and children. The success of these initiatives hinge on state and federal policies and funding priorities.24 Notable reductions in funding for public health maternal and child health initiatives in California have also influenced the range and scope of interventions supporting this vulnerable population.25 Despite these factors, Figure 1 shows diverse examples from the SJV county local health departments of ongoing initiatives and activities to promote the health of young women. By examining variations across the SJV, this analysis can help local health departments and their partners identify additional avenues to improve the health of young women.
| County | Examples of Current Initiatives |
|---|---|
| Kings |
|
| Fresno |
|
| Madera |
|
| Merced |
|
| San Joaquin |
|
| Stanislaus |
|
| Tulare |
|
Methods
This report utilizes data from a variety of statewide governmental agencies. Hospital discharge data and the birth statistical master files for the years 2009-2013 were obtained from the Office of Statewide Health Planning and Development (OSHPD) and the California Department of Public Health (CDPH), respectively. Approval from the California Department of Public Health Vital Statistics Advisory Committee (VSAC) and the California Health and Human Services Agency’s Committee for the Protection of Human Subjects (CPHS) was obtained.
The Office of Environmental Health Hazard Assessment (OEHHA) identified and grouped key indicators to produce the CalEnviroScreen (CES) score. Pollution burden and population characteristics are the two indices that create the cumulative impact score from the CES 2.0. Indicators that compose the pollution burden score, including particulate matter 2.5 (PM2.5) and diesel particulate matter, were used to highlight neighborhood level influences on women’s health.
The Regional Opportunity Index (ROI) is an index that helps to target resources and economic opportunity in California’s communities developed by UC Davis Center of Regional Change. Neighborhood-level indicators of economic opportunity were selected from the ROI to investigate communities with the most need in the SJV.
California Health Interview Survey (CHIS) was used to estimate preconception health indicators among young women in the SJV. Data is publicly available through UCLA’s Center for Health Policy and Research online system, Ask CHIS.
All data files mentioned above provided information on place of residence (zip code or census tract), age, sex, and other non-identifiable demographics. All rates and population estimates were based on 2010 Census files.
Printed page 6
Analysis
For the purpose of this report, teen births and PTB are treated as the primary health outcomes of interest throughout this report. Descriptive analysis was conducted on all health outcomes to uncover rates and proportions by population characteristics. Each health outcome in the SJV region is compared to the state on a variety of platforms including by county, demographic characteristics and geographic distribution. An extensive, in-depth analysis of teen births and PTBs is presented showing the proportion of PTBs as well as a multilevel model incorporating neighborhood determinants that contribute to maternal health outcomes beyond individual characteristics. All analyses are presented in figures, tables, and maps below.
Findings
The SJV counties is home to some of the youngest populations and has some of the highest rates of teen birth observed in the state of California. Figure 2 illustrates that all eight counties of the SJV have significantly higher rates of teen births than the state as a whole. Six of the eight counties have a teen birth rate 50% greater than that of the state. From 2009 to 2013, all observations of teen birth rates were greater in each of the eight counties when compared to the rest of the state. Furthermore, Kern, Madera, and Tulare County had significantly higher teen birth rates than the other SJV counties. Tulare County had the highest teen birth rate (54/1,000 in population). Despite having some of the highest rates of teen birth in the nation, Figure 2 demonstrates a clear downward trend over time for California and the SJV Counties. An 11% decrease in teen births was observed for California over the five year period, while a similar trend was observed for each of the the SJV counties.
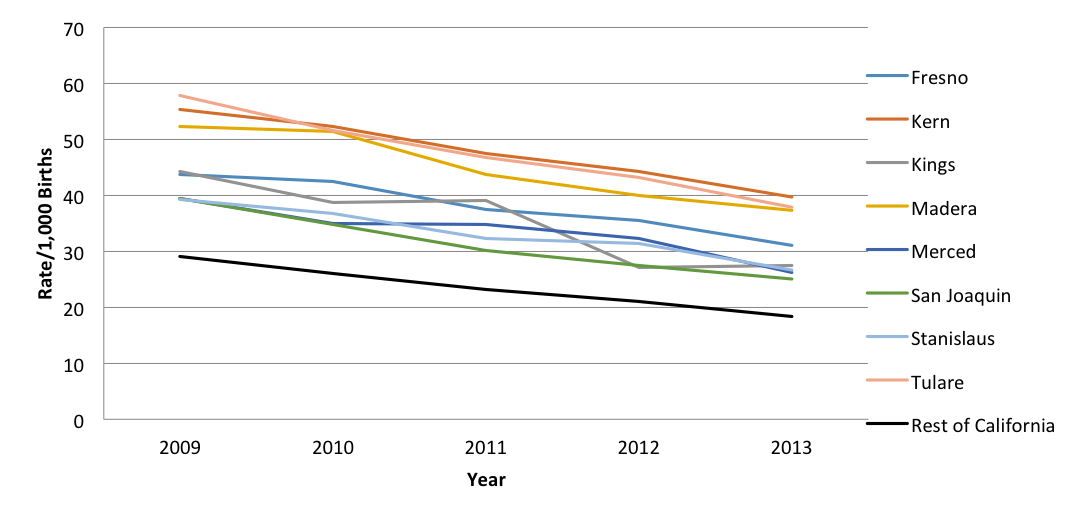
Chart description: The horizontal axis, “Year,” shows 2009, 2010, 2011, 2012, and 2013. The vertical axis, “Rate/1,000 Births,” runs from 0 to 70 in increments of 10. Legend entries, in printed order, are Fresno, Fresno, Kern, Kings, Madera, Merced, San Joaquin, Stanislaus, Tulare, and Rest of California. “Fresno” appears twice in the source legend. The plotted county rates are above the Rest of California line and decline over the period. Exact annual values are not labeled.
Printed page 7
As shown in Figure 3, about 50% of the female population between the ages of fifteen and nineteen are Latina. Whites are 24% of this population and “Others,” Asians, and African Americans compose 14%, 7%, and 4%, respectively. The lower bar displays the distribution of teen births by race/ethnicity. The distribution of teen births is significantly different than that of the general population. Latinas and African Americans share a disproprotionate burden of teen pregnancies in the SJV. Latinas display a 19% increase in the teen birth distribution while whites show a 9% decrease than what may be expected from the general population. Although African Americans represent a small percentage of the population, they compose almost 1.5 times more of the teen birth distribution than they do of the general population, this is the largest increase of any race/ethnicity.
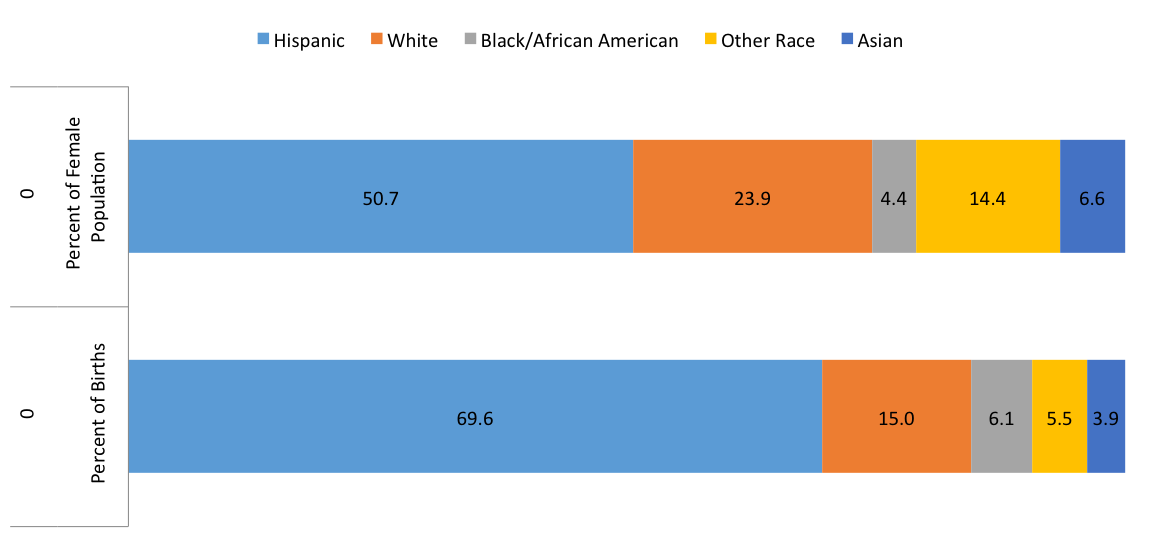
| Race/Ethnicity | Percent of Female Population | Percent of Births |
|---|---|---|
| Hispanic | 50.7% | 69.6% |
| White | 23.9% | 15.0% |
| Black/African American | 4.4% | 6.1% |
| Other Race | 14.4% | 5.5% |
| Asian | 6.6% | 3.9% |
The eight SJV counties have a greater rate of teen birth than the state (22 per 1,000 births) as a whole. The county birth rates for Stanislaus, Merced, Fresno, Madera, Kings, Kern, and Tulare were 35.8, 41.66, 46.3, 49.8, 50.6, 53.4, and 53.7 per 1,000 live births, respectively. Figure 4 illustrates the geographic distribution of teen birth rates by zip code. The shading of zip codes is relative to the state rate of 22 teen births per 1,000 in the population. Each county in the SJV has at least three zip codes with a teen pregnancy rate of 36 per 1,000, or greater, demonstrating the magnitude and pervasiveness throughout the region. Teen birth rates are highly varied by geographic location, 44% of the communities in the SJV have a teen pregnancy rate that is one standard deviation greater than California’s average and 32% are two standard deviations greater.
Printed page 8
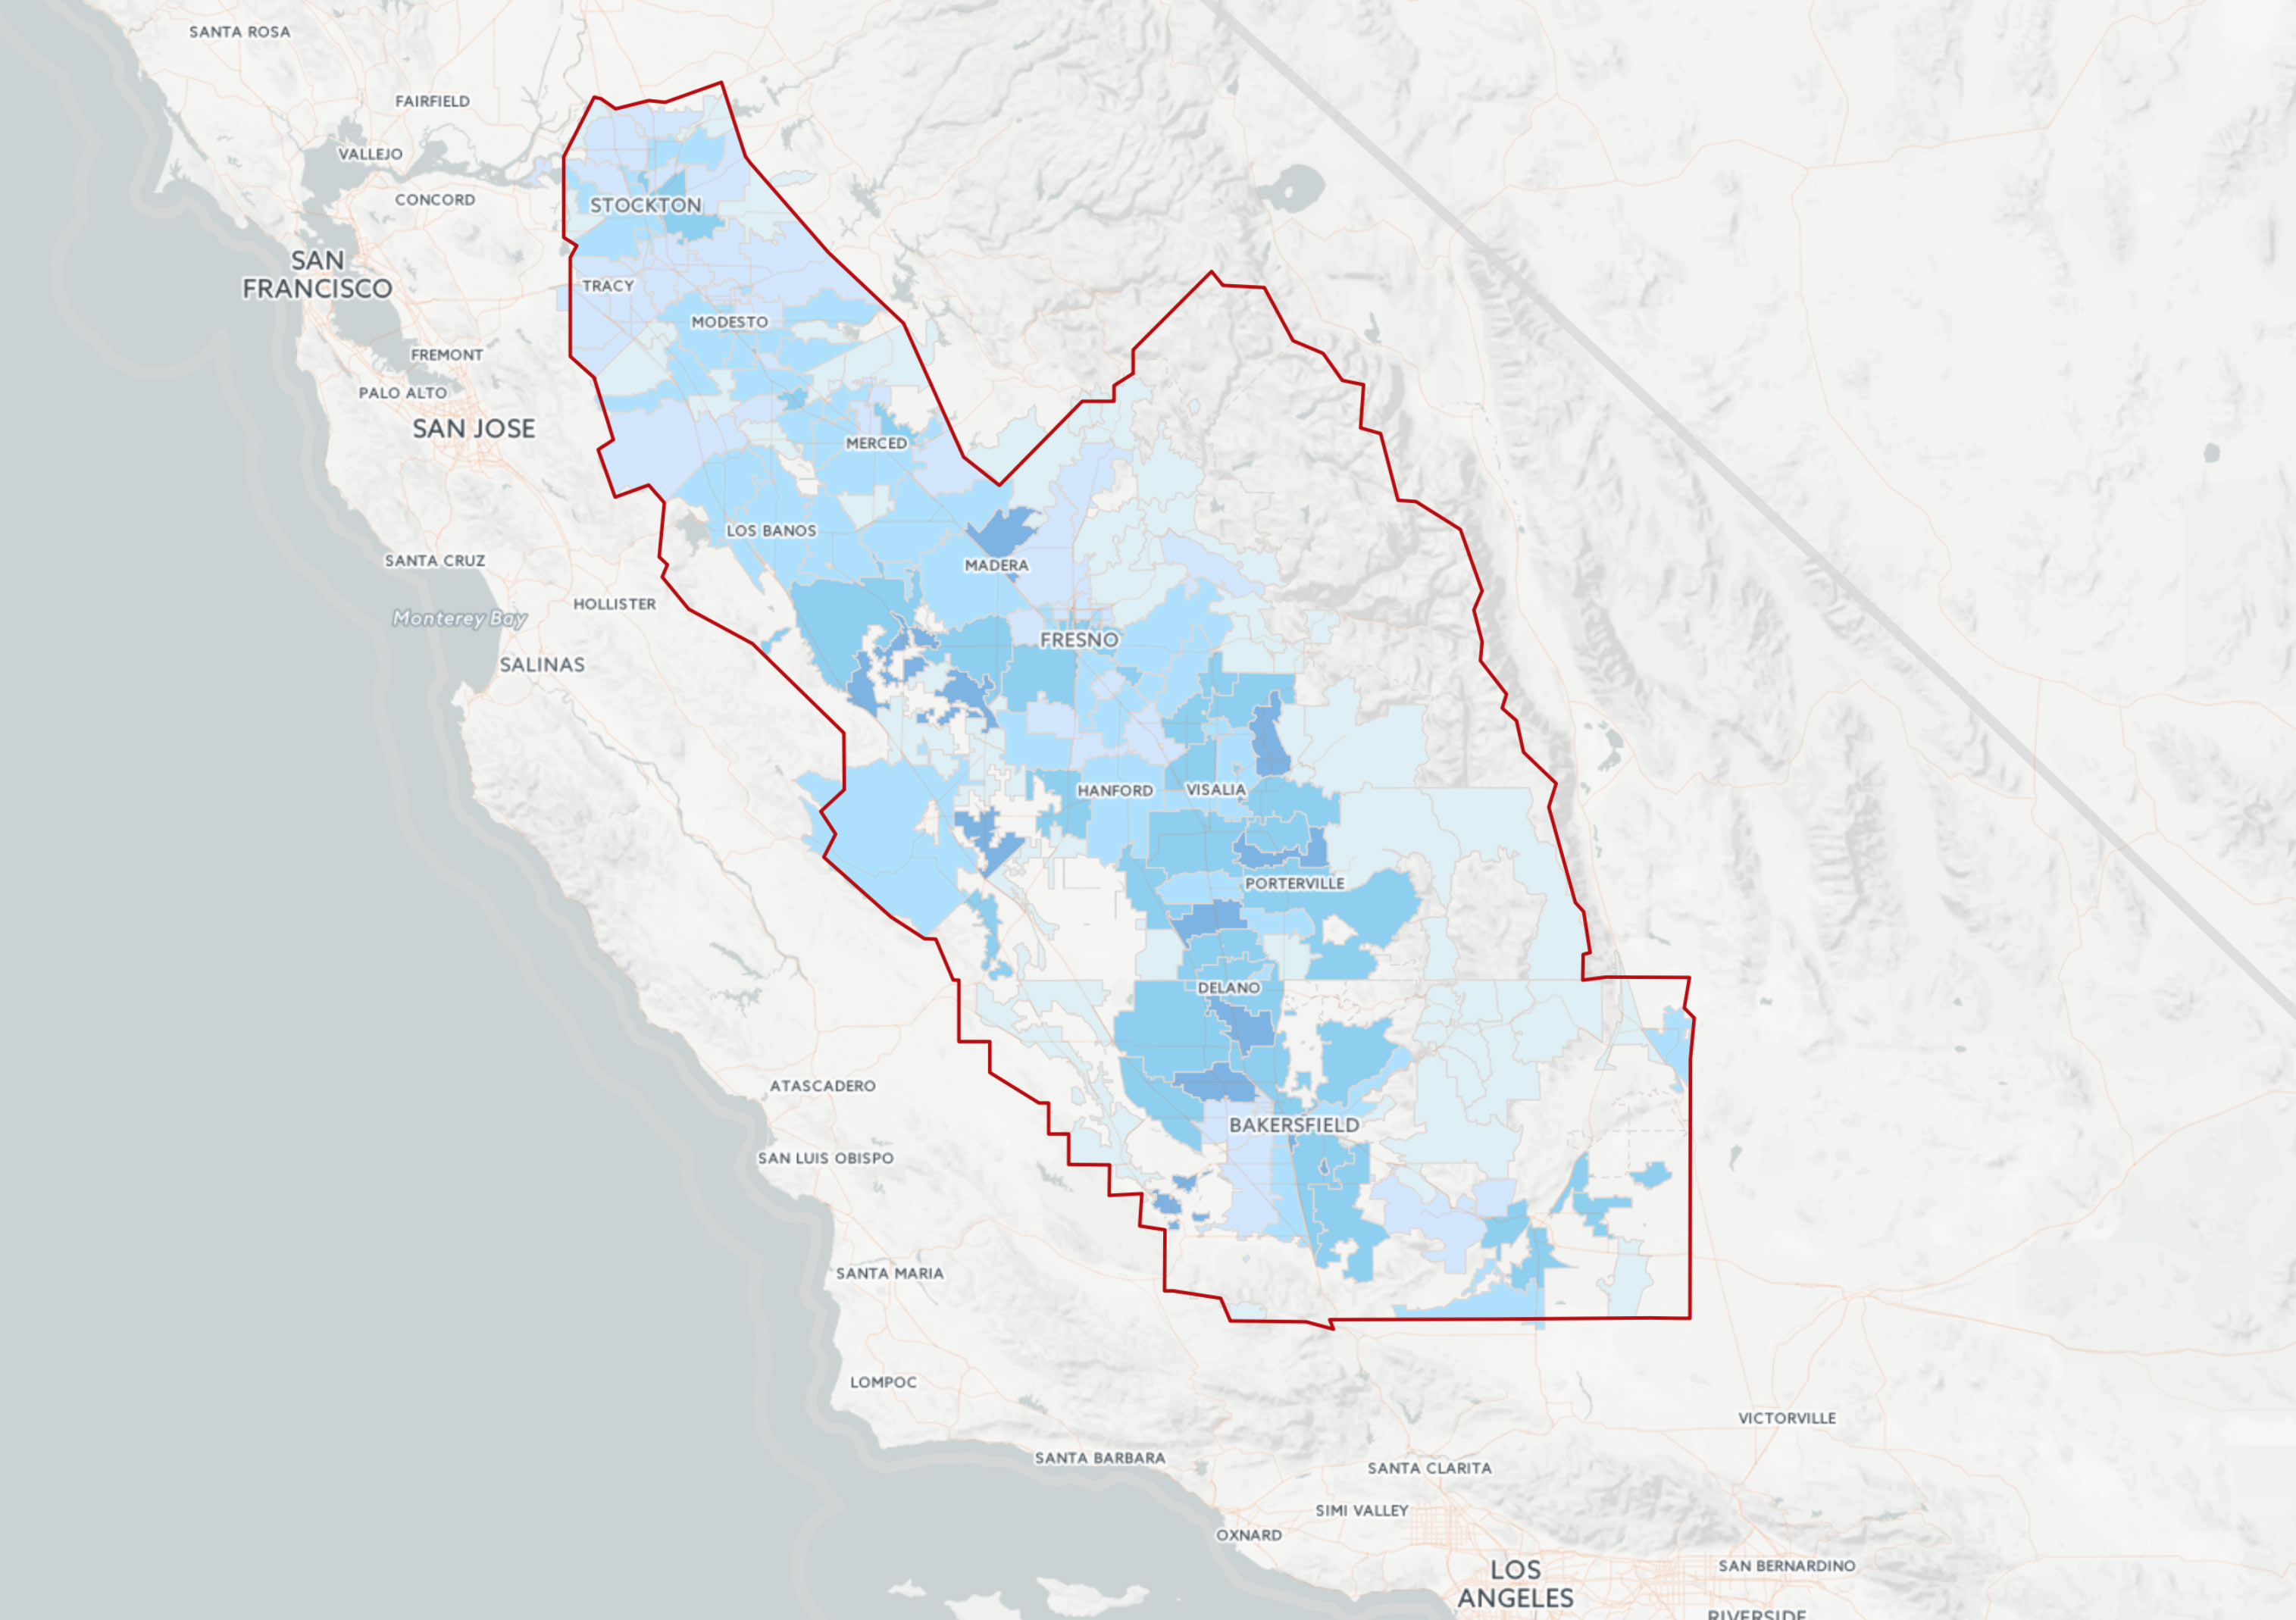
Map description: A red outline encloses the San Joaquin Valley study region. Zip-code areas are shaded from light to darker blue according to “Teen Birth Rate 2010 to 2012”; the legend endpoints are 0 and 89. The map extends from the Stockton area in the north to the Bakersfield area in the south. Exact values for individual zip codes are not labeled.
Poverty and Teen Births
In Figure 5, we the results of a hierarchical regression model which controls for individual and neighborhood level factors and their association with teen births. Our analysis suggests that teen pregnancy varies by individual level indicators as well as across communities in the SJV. In Figure 5, we illustrate the odds ratios and 95% confidence intervals for indicators that are significantly associated with teen births. Figure 5 shows that all women of color are at significantly higher risk for teen births when compared to white women. Specifically, Latinas, African-Americans, Asians, and “Other” were at 2.28, 1.63, 2.10, and 2.10 times more likely than Whites, respectively. Foreign-born women were found to be 0.45 times less likely to have a teen birth than US-born women. Mothers on Medi-Cal and other public insurance types are 4.57 and 2.87 times more likely to have a teen birth than mothers with private coverage, respectively. Neighborhood poverty is positively associated with teen birth rates. In communities where at least 18% of the population was living two times below the Federal Poverty Level, the odds for teen birth were 1.38 times greater than in affluent communities. In communities considered to be in extreme poverty, where at least 33% of individuals were living two times below the Federal Poverty Level, the odds for teen birth were 1.46 times greater than in affluent communities.
Printed page 9
Chart description: The horizontal axis is “Odds Ratio,” ranging from 0 to 6 in increments of 1; the vertical axis is “Indicator.” Points and horizontal intervals show odds ratios and 95% confidence intervals. The chart groups its indicators as follows:
- Non-Modifiable
- Latina/Hispanic; African-American; Asian; Other Race; Foreign-born.
- Modifiable
- Medi-Cal; Other Payer; Overweight (BMI 25 - 29); Obese (BMI 30+); Poverty; Extreme Poverty.
The plotted estimates for Foreign-born, Overweight, and Obese are below 1; the other plotted estimates are above 1. Exact point estimates and confidence-interval endpoints are not labeled in the chart. Numerical estimates stated in the report are preserved in the preceding paragraph.
Despite geographic variation in birth outcomes, Table 2 shows that mothers across age groups consistently received prenatal care in the SJV. Mother’s younger than the age of 20 received the lowest rate of prenatal care at 93.8%. Women between the ages of 30 and 34 received the highest rate at 96.7%. Prenatal care services tended to increase with the age of the mother but there were no significant differences across age groups. Although 95.9% of mothers aged 35 years or older received prenatal care, this age group presented the highest risk for premature birth, low-birth weight, and infant mortality. Women who gave birth prior to 20 years of age were more similar to the oldest age group across birth outcomes than to any other age group. The youngest and oldest age groups were the only two age group that had significantly higher rates of low-birth weight and infant mortality when compared to the overall group. Mother’s between the ages of 25 and 29 had the lowest rates of premature birth and low-birth weight.
Printed page 10
| Indicator | Younger than 20 | 20 to 24 | 25 to 29 | 30 to 34 | 35+ | All |
|---|---|---|---|---|---|---|
| Received Prenatal Care | 93.8% | 95.1% | 96.3% | 96.7% | 95.9% | 95.7% |
| Premature Birth | 9.8% | 9.3% | 9.2% | 10.3% | 12.0% | 9.8% |
| Low Birth Weight | 8.5% | 6.7% | 6.5% | 7.3% | 8.6% | 7.2% |
| Rate of Infant Mortality per 1,000 Births | 3.6 | 2.7 | 2.9 | 2.9 | 4.3 | 3.1 |
Social Determinants of Health
Figure 6 displays individual and neighborhood level indicators that are significantly associated with preterm birth (PTB), as determined by a hierarchical regression model. Odds ratios and 95% confidence intervals are displayed in order to show the magnitude of the relationship between each indicator and PTB. Indicators are categorized into two groups, modifiable and non-modifiable.
As expected, there were significant differences in the risk for PTB by the mother’s age. Mothers who were older than 29 years of age were found to be at significantly higher risk for PTB, in comparison to mothers between the age of 25 and 29. However, the youngest group and the oldest group presented the greatest risk for PTB in comparison to mothers between the age of 25 and 29, with 1.26 and 1.47 times the risk, respectively. Mothers between the age of 20 and 24 were significantly less likely for PTB than the reference group, 0.88 odds ratio (OR). African-Americans were at significantly greater risk than Whites, with an OR of 1.58. Asians and “other” races/ethnicities were also at significantly greater risk than Whites, with 1.33 and 1.28 odds ratio, respectively. Modifiable indicators were found to have a greater association with PTB when compared to non-modifiable. Similar to Table 3, having a previous PTB, hypertension, or mothers who smoked were at greatest risk for PTB, with 4.85, 3.91, and 1.43 times more likely than their counterparts (mothers who did not present any of these indicators), respectively. Mothers on Medi-Cal and other forms of public insurance were at 1.21 and 1.33 times more likely to have a PTB than mothers who had private insurance.
Mothers who had an infection present throughout pregnancy, who received WIC services, or earned a Bachelor’s Degree were significantly less likely to have a PTB. We hypothesize that these individuals represent groups who have greater access to preventive care and who are closely monitored by a medical team.
Although individual-level indicators explained for the majority of variation in PTB, particulate matter 2.5 (PM2.5) and economic opportunity measured at the zip code level were significantly associated with PTB even after controlling for individual level differences. PM2.5 was significant and positively associated with PTB. The odds ratio for PM2.5 was 1.03, which indicated that for every percentage increase in PM2.5 a 3% increase in PTB was expected. This environmental factor is extremely concerning, given the proximity of urban centers in the SJV to high-transit and shipping veins, notable I-5 and I-99. The indicator for poverty—economic opportunity—was significant and negatively associated with PTB. This suggested that in communities where economic opportunity was highest, the lowest rates of PTB were observed. The odds ratio for economic opportunity was 0.99, which indicated that for every percentage increase in economic opportunity a 1% decrease in PTB was expected. This indicator captures those neighborhoods that have the highest percentages of employed adults and families with income over 200% of the federal poverty level where employment rates are sustained.
Printed page 11
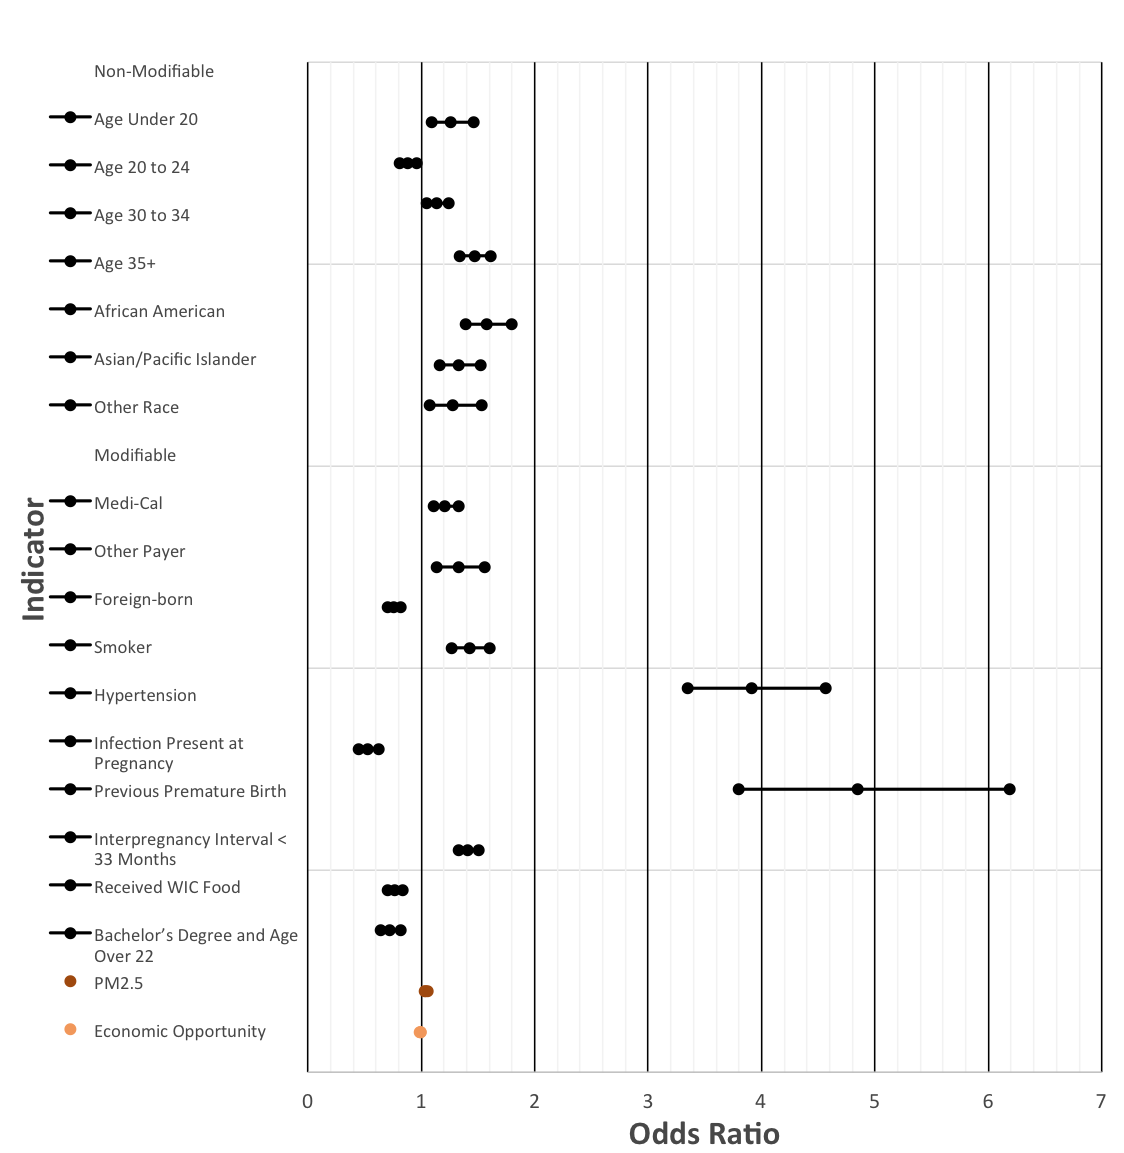
Chart description: The horizontal axis is “Odds Ratio,” ranging from 0 to 7 in increments of 1; the vertical axis is “Indicator.” Points and horizontal intervals show odds ratios and 95% confidence intervals. The chart groups its indicators as follows:
- Non-Modifiable
- Age Under 20; Age 20 to 24; Age 30 to 34; Age 35+; African American; Asian/Pacific Islander; Other Race.
- Modifiable
- Medi-Cal; Other Payer; Foreign-born; Smoker; Hypertension; Infection Present at Pregnancy; Previous Premature Birth; Interpregnancy Interval < 33 Months; Received WIC Food; Bachelor’s Degree and Age Over 22; PM2.5; Economic Opportunity.
The plotted estimates for Age 20 to 24, Foreign-born, Infection Present at Pregnancy, Received WIC Food, Bachelor’s Degree and Age Over 22, and Economic Opportunity are below 1. The remaining plotted estimates are above 1. Exact point estimates and confidence-interval endpoints are not labeled in the chart. Numerical estimates stated in the report are preserved in the preceding paragraphs.
Printed page 12
Discussion and Recommendations
More investigation into the individual and community level factors is needed to adequately understand and improve the environment in which young women grow, are educated, work and raise families. To support individual women, researchers and health practitioners recommend comprehensive health care and reproductive life planning before and between each pregnancy in the form of comprehensive preconception care.26, 27 This preventive approach emphasizes behaviors and health conditions that must be addressed before conception to have maximum impact. Thus, it requires more than a single visit for care and involves health promotion and disease management by combining the best of medical care, healthy behaviors, strong support, and safe environments for all women of reproductive ages.
In terms of neighborhood and socioeconomic influences, environments that have few resources, are polluted and possibly violent inflict a persistent stress on young women prior to and during pregnancy and has been shown to substantially impair their ability to experience a healthy pregnancy. Exploring opportunities to improve these environments, as well as provide women support and tools to manage the resulting stress and depression, would benefit present and future generations.
The local health departments have taken varied strategies to promote reproductive health in order to have maximum impact on communities. Generally, these strategies have targeted modifiable characteristics of individuals. Efforts are being made to provide reproductive education in different settings to reach youth and families including schools, faith-based organizations, and the within the local health department buildings. The San Joaquin Valley local health departments have a long history of providing free STI/HIV testing as well as in reducing tobacco marketing in communities that have been historically susceptible to these indicators of poor reproductive health. However, the findings within this report suggest that the San Joaquin Valley continues to host reproductive disparities which are pervasive among women who are of color, low educations status, low socioeconomic status, and young.
There is evidence that there are modifiable protective factors associated with reproductive health outcomes that may warrant further inquiry. For example, these data suggest that WIC services are associated with reduced risk for premature birth. Nonetheless, it is difficult to determine what it is about WIC services that may contribute to this positive outcome. Also, mothers who had an infection present during pregnancy were at reduced risk for negative birth outcomes. We suspect that this may represent a group of mothers who were supported by a group of medical professionals who were tracking the pregnancy closely.
Although a large proportion of the health outcomes presented above can be explained by mothers’ characteristics, associations between modifiable community characteristics and birth outcomes should be highlighted. Communities of poverty were strongly associated with poor birth outcomes which is consistent with previous findings. When we used variables describing communities of economic opportunity, we found a reduced risk for poor birth outcomes, compared to those with less economic opportunity. By using community measures of poverty and economic opportunity, the case for socioeconomic disparities in health is strengthened. Beyond community measures for socioeconomic status (i.e., poverty and economic opportunity), environmental associations were found, specifically, an association between air pollution and premature birth.
Potential Initiatives to Improve Young Women’s Health
County Public Health Departments play a key role in encouraging and providing leadership towards improving Maternal and Child Health equity, particularly in diverse contexts. In particular, there are three specific opportunities that Public Health Departments can champion at the county level:

Printed page 13
Promote high quality and culturally responsive reproductive clinical care in patient-centered systems, informed by scientific consensus and national best practice evidence.
In the SJV, several counties are engaging in this effort by identifying and fostering opportunities to train and retain physicians and providers in other medical specialties (Nurse Practitioners, Registered Nurses, etc.) that are multi-lingual and culturally sensitive. Public Health Departments are also engaging practitioners to discuss developing new partnerships that will increase access to quality, coordinated and evidence-based care.
Provide individually oriented education, health promotion, screening and interventions for women of reproductive age to reduce risk factors that might affect pregnancy outcomes.
The “promotora” or community health worker (CHW) model has received significant attention recently as an opportunity to provide social, economic and health support for women. CHWs visit women in home settings to promote preventive measures including breastfeeding, nutrition, homemaker assistance, healthcare system navigation, etc. Ideally, CHWs are members of the communities in which they serve, providing both context and a role model for women in need of support. Developing and funding these programs is a high priority goal for several SJV counties.
Investigate and increase the responsiveness of policies and programs to social, economic and environmental factors that impact pregnancy and early childhood outcomes.
This multi-level, interdisciplinary goal requires new collaborations and unique partnerships. Some counties in the SJV are coordinating across sectors to consider the built environment and adopt health-friendly policies and improve the physical infrastructure for healthy living. Those invited to engage and frame new policies include government agencies, businesses, employers, developers, and families.
Limitations
ICD-9 codes are used to determine maternal co-morbidities and though evaluating principal ICD-9 codes has been used extensively to estimate burden of disease, it remains an imperfect process. ICD-9 codes are reported by a physician for billing purposes and there may be discrepancy between practitioners in terms of what is considered the most pressing health condition to report initially.
Printed page 14
References
- Elder Jr GH. The life course paradigm: Social change and individual development. 1995.
- Lu MC. Healthcare Reform and Women’s Health: A Life-course Perspective. Current Opinion in Obstetrics & Gynecology 2010;22:487-91.
- Andreasen KR, Andersen ML, Schantz AL. Obesity and pregnancy. Acta Obstet Gynecol Scand 2004;83:1022-9.
- Hoffman SD, Maynard RA. Kids Having Kids: Economic Costs & Social Consequences of Teen Pregnancy. Washington, D.C.: Urban Institute Press; 2008.
- Kozuki N, Lee ACC, Silveira MF, et al. The Associations of Parity and Maternal Age with Small-for-gestational-age, Preterm, and Neonatal and Infant Mortality: A Meta-analysis. BMC Public Health 2013.
- Gibbs CM, Wendt A, Peters S, Hogue CJ. The Impact of Early Age at First Childbirth on Maternal and Infant Health. Paediatr Perinat Epidemiol 2012;26:259-84.
- Goossens G, Kadji C, Delvenne V. Teenage Pregnancy: A Psychopathological Risk for Mothers and Babies? Psychiatria Danubina 2015;27 Suppl 1:499-503.
- Preterm births, percent of lives births: United States, 2003-2013 [graph]. National Center for Health Statistics, Final Natality Data. 2016. (Accessed May 25, 2016, at http://www.marchofdimes.org/peristats/Peristats.aspx.)
- Teen Pregnancy Prevention at School-Based Health Centers: Challenges & Opportunites. 2015. (Accessed June 27, 2016, at https://www.schoolhealthcenters.org/wp-content/uploads/2015/02/CSHA-Teen-Pregnancy-Prevention-SBHCs-2015.pdf.)
- Sarwer DB, Allison KC, Gibbons LM, Markowitz JT, Nelson DB. Pregnancy and Obesity: A Review and Agenda for Future Research. Journal of Women’s Health (2002) 2006;15:720-33.
- Brown K, Apuzzio J, Weiss G. Maternal Obesity and Associated Reproductive Consequences. Women’s Health 2010;6:197-203.
- Stotland NE. Obesity and Pregnancy. Br Med J 2009;338:107.
- California Health Interview Survey. 2009.
- Finer LB, Henshaw SK. Disparities in Rates of Unintended Pregnancy in the United States, 1994 and 2001. Perspectives on Sexual and Reproductive Health 2006;38:90-6.
- National Prematurity Awareness Month. 2015. (Accessed June 27, 2016, at http://www.cdc.gov/Features/PrematureBirth/.)
- The impact of premature birth on society. 2015. (Accessed June 27, 2016, at http://www.marchofdimes.org/mission/the-economic-and-societal-costs.aspx.)
- Penman-Aguilar A, Carter M, Snead MC, Kourtis AP. Socioeconomic disadvantage as a social determinant of teen childbearing in the U.S. Public Health Rep 2013;128 Suppl 1:5-22.
- Maness SB, Buhi ER. Associations Between Social Determinants of Health and Pregnancy Among Young People: A Systematic Review of Research Published During the Past 25 Years. Public Health Rep 2016;131:86-99.
- Johnson K, Posner SF, Biermann J, et al. Recommendations to improve preconception health and health care--United States. A report of the CDC/ATSDR Preconception Care Work Group and the Select Panel on Preconception Care. MMWR Recomm Rep 2006;55:1-23.
- Bronfenbrenner U. The Ecology of Human Development : Experiments by Nature and Design. Cambridge, Mass.: Harvard University Press; 1979.
- Lu MC, Halfon NC. Racial and Ethnic Disparities in Birth Outcomes: A Life-Course Perspective. Maternal and Child Health Journal 2003;7:13-30.
- Davies MJ, Norman RJ. Programming and reproductive functioning. Trends Endocrinol Metab 2002;13:386-92.
- Klawetter S. Conceptualizing Social Determinants of Maternal and Infant Health Disparities. Affilia 2014;29:131-41.
- Capitman JA, Bengiamin M. Operational and stautory capacity of local health departments in the San Joaquin Valley. Fresno, CA: California State University, Fresno; 2013.
- Basurto-Davila R. Health Impact of Changes in Funding Allocations to Maternal, Child, and Adolescent Health Programs. Los Angeles, CA: Los Angeles County Department of Public Health; 2014.
- California Demonstrates That Sound Policy Is Crucial In Reducing Teen Pregnancy. 2016. (Accessed May 19, 2010, at https://www.guttmacher.org/news-release/2010/california-demonstrates-sound-policy-crucial-reducing-teen-pregnancy.)
- Gilman SL. Fat : A Cultural History of Obesity. Cambridge, UK ; Malden, MA, USA: Polity; 2008.