
Preventable Childhood Illness



Individual and Neighborhood Characteristics

San Joaquin Valley Public Health Consortium — Health Equity for All
Fresno State Central Valley Health Policy Institute
Central California Center for Health and Human Services1625 East Shaw Avenue, Suite 146
Fresno, CA 93710-8106
Phone: 559.228.2150 Fax: 559.228.2168
www.cvhpi.org


Abstract
Reducing rates of childhood illness is a key public health objective, given that many of the conditions developed in childhood will negatively impact the individual well into adulthood. This report draws on multiple data sources to describe childhood morbidity and mortality as well as the individual and social determinants of these outcomes in California’s eight San Joaquin Valley counties. Findings indicate that children that are non-white and underserved are likely experiencing less access to preventable care, more stressful and harmful neighborhood environments and have fewer resources to address health challenges. For example, results indicate higher rates of preventable hospitalizations in the region than the state as a whole and broad differences by individual and neighborhood factors in risk of these events. If children of color had similar preventable hospitalization rates as their white peers in affluent neighborhoods, there would be a 62% reduction in these events, a possible costs savings of $19,113,621. The eight San Joaquin Valley Public Health Departments can continue play a key role in encouraging improving Maternal and Child Health equity by:
- Promoting high quality and culturally responsive perinatal clinical care in patient-centered systems, informed by scientific consensus and national best practice evidence
- Providing individually oriented education, health promotion, screening and interventions for women and men of reproductive age to reduce risk factors that might early childhood outcomes
- Increasing the responsiveness of policies and programs to social, economic and environmental factors that impact childhood outcomes
Introduction

Reducing rates of childhood illness is a key public health objective, given that many of the conditions developed in childhood will negatively impact the individual well into adulthood. Known as the “long arm of childhood,” pediatric physical health and social characteristics are strong predictors of an individual’s health trajectory. 1,2 In this report, emergency department (ED) visits, hospitalizations and pediatric mortality data will help highlight the families and communities in California’s San Joaquin Valley (SJV) that are disproportionately impacted by child morbidity and mortality. Although most children experience neither hospital use (inpatient or emergency room) nor death, these relatively rare and costly health events are associated with more negative self-reported health.3 Although examining these most adverse health events does not provide a complete picture of the overall health of children in the region, they are indicative of the burden of disease faced by children and their families. Emergency department visits, hospital visits and mortality are representative of a high burden of disease that negatively impacts many children and families and can often be prevented through earlier interventions including improvements in living conditions, home-based care, primary care and urgent care visits.4 Families and communities with high rates childhood morbidity and mortality experience increased suffering, life disruption and higher private and public costs of illness.5
Childhood Hospitalization and Emergency Department Admissions: Preventable/Non-Preventable
For this report, hospital in-patient and emergency department admissions are categorized as preventable or non-preventable based on the specific medical conditions listed as the primary cause of admission. Admissions characterized as preventable are for ambulatory care sensitive conditions (ACSC), diagnoses for which timely and effective community and health system supports reduce the likelihood of hospitalizations through prevention and/or management of a health condition.6 Examples of ACSC diagnoses include asthma, pneumonia and conditions for which immunizations are available. 7 For most ASCS pediatric conditions, family resources and capacity to manage health challenges are key factors in avoiding the need for acute care. For the two most common conditions for which children are hospitalized, asthma and pneumonia, high quality home-based care and early preventive care are highly successful at reducing related hospitalizations and advanced morbidity. For pediatric asthma, successful home based interventions address environmental triggers and help family members to respond effectively to signs of advancing illness.8 Pediatric pneumonia, in many cases, is an advanced stage of morbidity that can result from several childhood illness for which vaccines are currently available and as such, preventative care initiatives are best-suited. Improving vaccine rates of those who can be vaccinated will protect young children through herd immunity and lower the incidence of disease for all high-risk populations. Non-preventable conditions are included in the report because a growing literature indicates that families and communities with higher rates of preventable pediatric acute events also face greater risk for non-preventable admissions.9
Pediatric Illness and Communities

There is a growing consensus from studies in California and other states that the risk for the most burdensome adverse health events for children --pediatric hospitalization, emergency room use, and mortality— varies by demographic and neighborhood factors.7,10,11 While African Americans experience notably higher rates than do whites, Latinos and Asians/ Pacific Islanders experience lower rates. Across racial/ ethnic groups, communities with lower socio-economic status, greater diversity, and limited access to health care experience more of these child health events.12 Understanding the characteristics of communities disproportionately experiencing pediatric morbidity and mortality is an important step in identifying associated causes and effective responses. Research in this area has uncovered an overall pattern suggesting that the clustering of social, economic, and environmental health risks in low-income and racially segregated neighborhoods limits opportunities for people in these communities to live healthy lives.13 Historically, rural communities were considered to be at higher risk for poor health based on their lower proximity to services.14 However, more recent studies have shown that poverty, race/ethnicity and financial limitations to health care play a larger role in predicting increased hospitalizations in communities than location alone.15,16 This shift in focus towards evaluating social, economic and environmental factors when considering an individual’s health is part of a large body of research investigating place-based causal mechanisms, the social determinants of health. Patterns reflecting long-standing disadvantage in low-income and racially/ ethnically isolated neighborhoods perpetuate cycles of poor health.17 Ultimately, inequalities in ED visits and hospitalizations point towards the larger issue of social inequalities in the living conditions and life opportunities that influence health.
Attention to the social and economic determinants of adverse health events for children follows from the broader view that the well-being, health and appropriate development of children are shaped by multiple factors including family, home, peer group, and neighborhood influence.18 For children, a number of neighborhood features, such as access to parks and opportunities for exercise, nutritious food, clean housing, safety from crime, employment and education opportunities and multiple other factors that support families in staying well, are less available in communities shaped by segregation and poverty.19,20 In the San Joaquin Valley, land use patterns and neighborhood formation were shaped by explicit segregation policies based on race/ethnicity and income.21 Reflecting this legacy, the Valley’s relatively small African American populations are most concentrated in specific older urban core and isolated rural communities with few amenities and multiple environmental challenges that also serve as the first places of residence for immigrants from Mexico and other countries. Hmong and other Southeast Asian immigrants have often first settled in these same communities. More affluent, resource and amenity dense communities have typically been developed more recently and have higher proportions of whites and lower proportions of low income persons. By describing how rates of adverse childhood health events are linked to racial/ethnic and poverty rate composition provide a lens for describing how children are influenced by a broader set of social and environmental factors.
Pediatric Illness and Health Departments
The link between childhood illness, neighborhood poverty, race/ethnicity and other factors has implications for San Joaquin Valley Public Health Consortium (SJVPHC) member local health departments because of their extensive maternal and child health programming. To some extent these local public health initiatives are shaped by state and federal policies and funding priorities.22 Notable reductions in funding for public health maternal and child health initiatives in California have also influenced the range and scope of initiatives. Despite these factors, Figure 1 shows diverse examples from the San Joaquin Valley county local health departments of ongoing initiatives and activities to promote child health and wellness. These efforts are directed to families, children, care providers and the broader community. These initiatives reflect the range of public health roles, including monitoring, public education, targeted community prevention programs, increasing access to health care, coordination of health and social services for at-risk groups, coordination of clinical care improvement collaborations, and broader collaborative efforts to promote health-friendly policies, facilities, and communities. By examining variations across the Valley in adverse pediatric outcomes, this analysis can help local health departments and their partners identify additional avenues to improve child health.
| County | Examples of Current Initiatives |
|---|---|
| Kings |
|
| Fresno |
|
| Madera |
|
| Merced |
|
| San Joaquin |
|
| Stanislaus |
|
| Tulare |
|
Methods
This report utilizes data from a variety of statewide governmental agencies. Death Statistical Master Files for the years 2009-2010 were obtained from the California Department of Public Health (CDPH). Emergency department visits and hospital admissions were gathered from the Office of Statewide Health Planning and Development (OSHPD), 2009-2011. Approval from the California Department of Public Health Vital Statistics Advisory Committee (VSAC) and the California Health and Human Services Agency’s Committee for the Protection of Human Subjects (CPHS) was obtained. All data files mentioned above provided information on place of residence (zip code), age, sex, and other non-identifiable demographics. All rates and population estimates were based on 2010 Census files.
Indicators
Children under fifteen years of age were included in all analyses. Descriptive statistics for both emergency department visits and hospital discharges suggested that this age cut-off was appropriate because children within this age group suffered from similar conditions, as opposed to older children that faced unique illnesses. For both emergency department visits and hospital admissions, ICD-9-codes were used to identify the primary reason for the patient’s visit. All individual cases were aggregated to the zip code-level to understand distributional differences in child illness between neighborhoods. Event cases were assigned to their respective zip code of residence.
All variables were measured at the zip code-level to illuminate geographic relationships of neighborhood composition. The majority of indicators were acquired from the American Community Survey (2010) including population estimates of age groups, race/ ethnicity, individuals living below 125% of the Federal Poverty Line (FPL), education, home ownership and employment. Further, measures of neighborhood context including number of healthcare facilities, median household income, proportion of new homes, commute time to work, and population density per square mile were also obtained through the American Community Survey.
Analysis
Geographic distributions of children of 18 years of age and younger were mapped for the state of California with an emphasis on the SJV. Rates of childhood morbidity and mortality were compared by race/ ethnicity within the SJV. Rates of childhood morbidity and mortality were also stratified by the eight counties within the SJV, and as a whole. The most commonly occurring preventable and non-preventable conditions in the SJV were identified. In the case of hospital admissions, we were able to compare the rates of diagnoses occurring in the SJV to the rest of California. Preventable ED visits and hospital admissions were then distributed by quintiles of poverty. Zip codes with similar characteristics of poverty were grouped together to examine any differences in rates in childhood morbidity. Death rates were also included in this section of the analysis.
Analysis of Expenditure
Analysis of expenditures was conducted for both preventable emergency department visits and hospital admissions for the three years (2009-2011) of data collection. The events were distributed into quintiles of poverty. Each quintile was then split into two racial/ ethnic categories (non-Hispanic Whites and Hispanics & non-Whites). The racial/ethnic categories were collapsed into non-Hispanic Whites and Hispanics & non-Whites to facilitate group comparison and to stabilize cost and population adjustments. The average cost of an event was stipulated to be $600.00 per emergency department visit and $6,583 for that of hospital admissions.23 The weighted average was adjusted for the relative racial/ethnic population differences between communities. The additional costs of pediatric care associated with racial/ethnic and neighborhood poverty differences are expressed as the potential cost savings if children of color, children living in poor communities, or children of color in poor communities to have similar utilization rates to whites and those living in less impoverished communities.
Findings
In the state of California, 25% of the population is under eighteen years of age and, on average, 22.3% of each zip code is composed of these youth. The SJV is home to some of the most concentrated geographic areas of youth. Figure 1 illustrates the percentage of the population that is under eighteen years of age. The highest quartile in Figure 1 represents zip codes with proportions of youth greater than 27.3% of the population. The top three zip codes in California that exceed 40% are found in the SJV. The SJV also has considerably different racial proportions than California in general, with 8% more Hispanic residents and 2% fewer African-American residents.
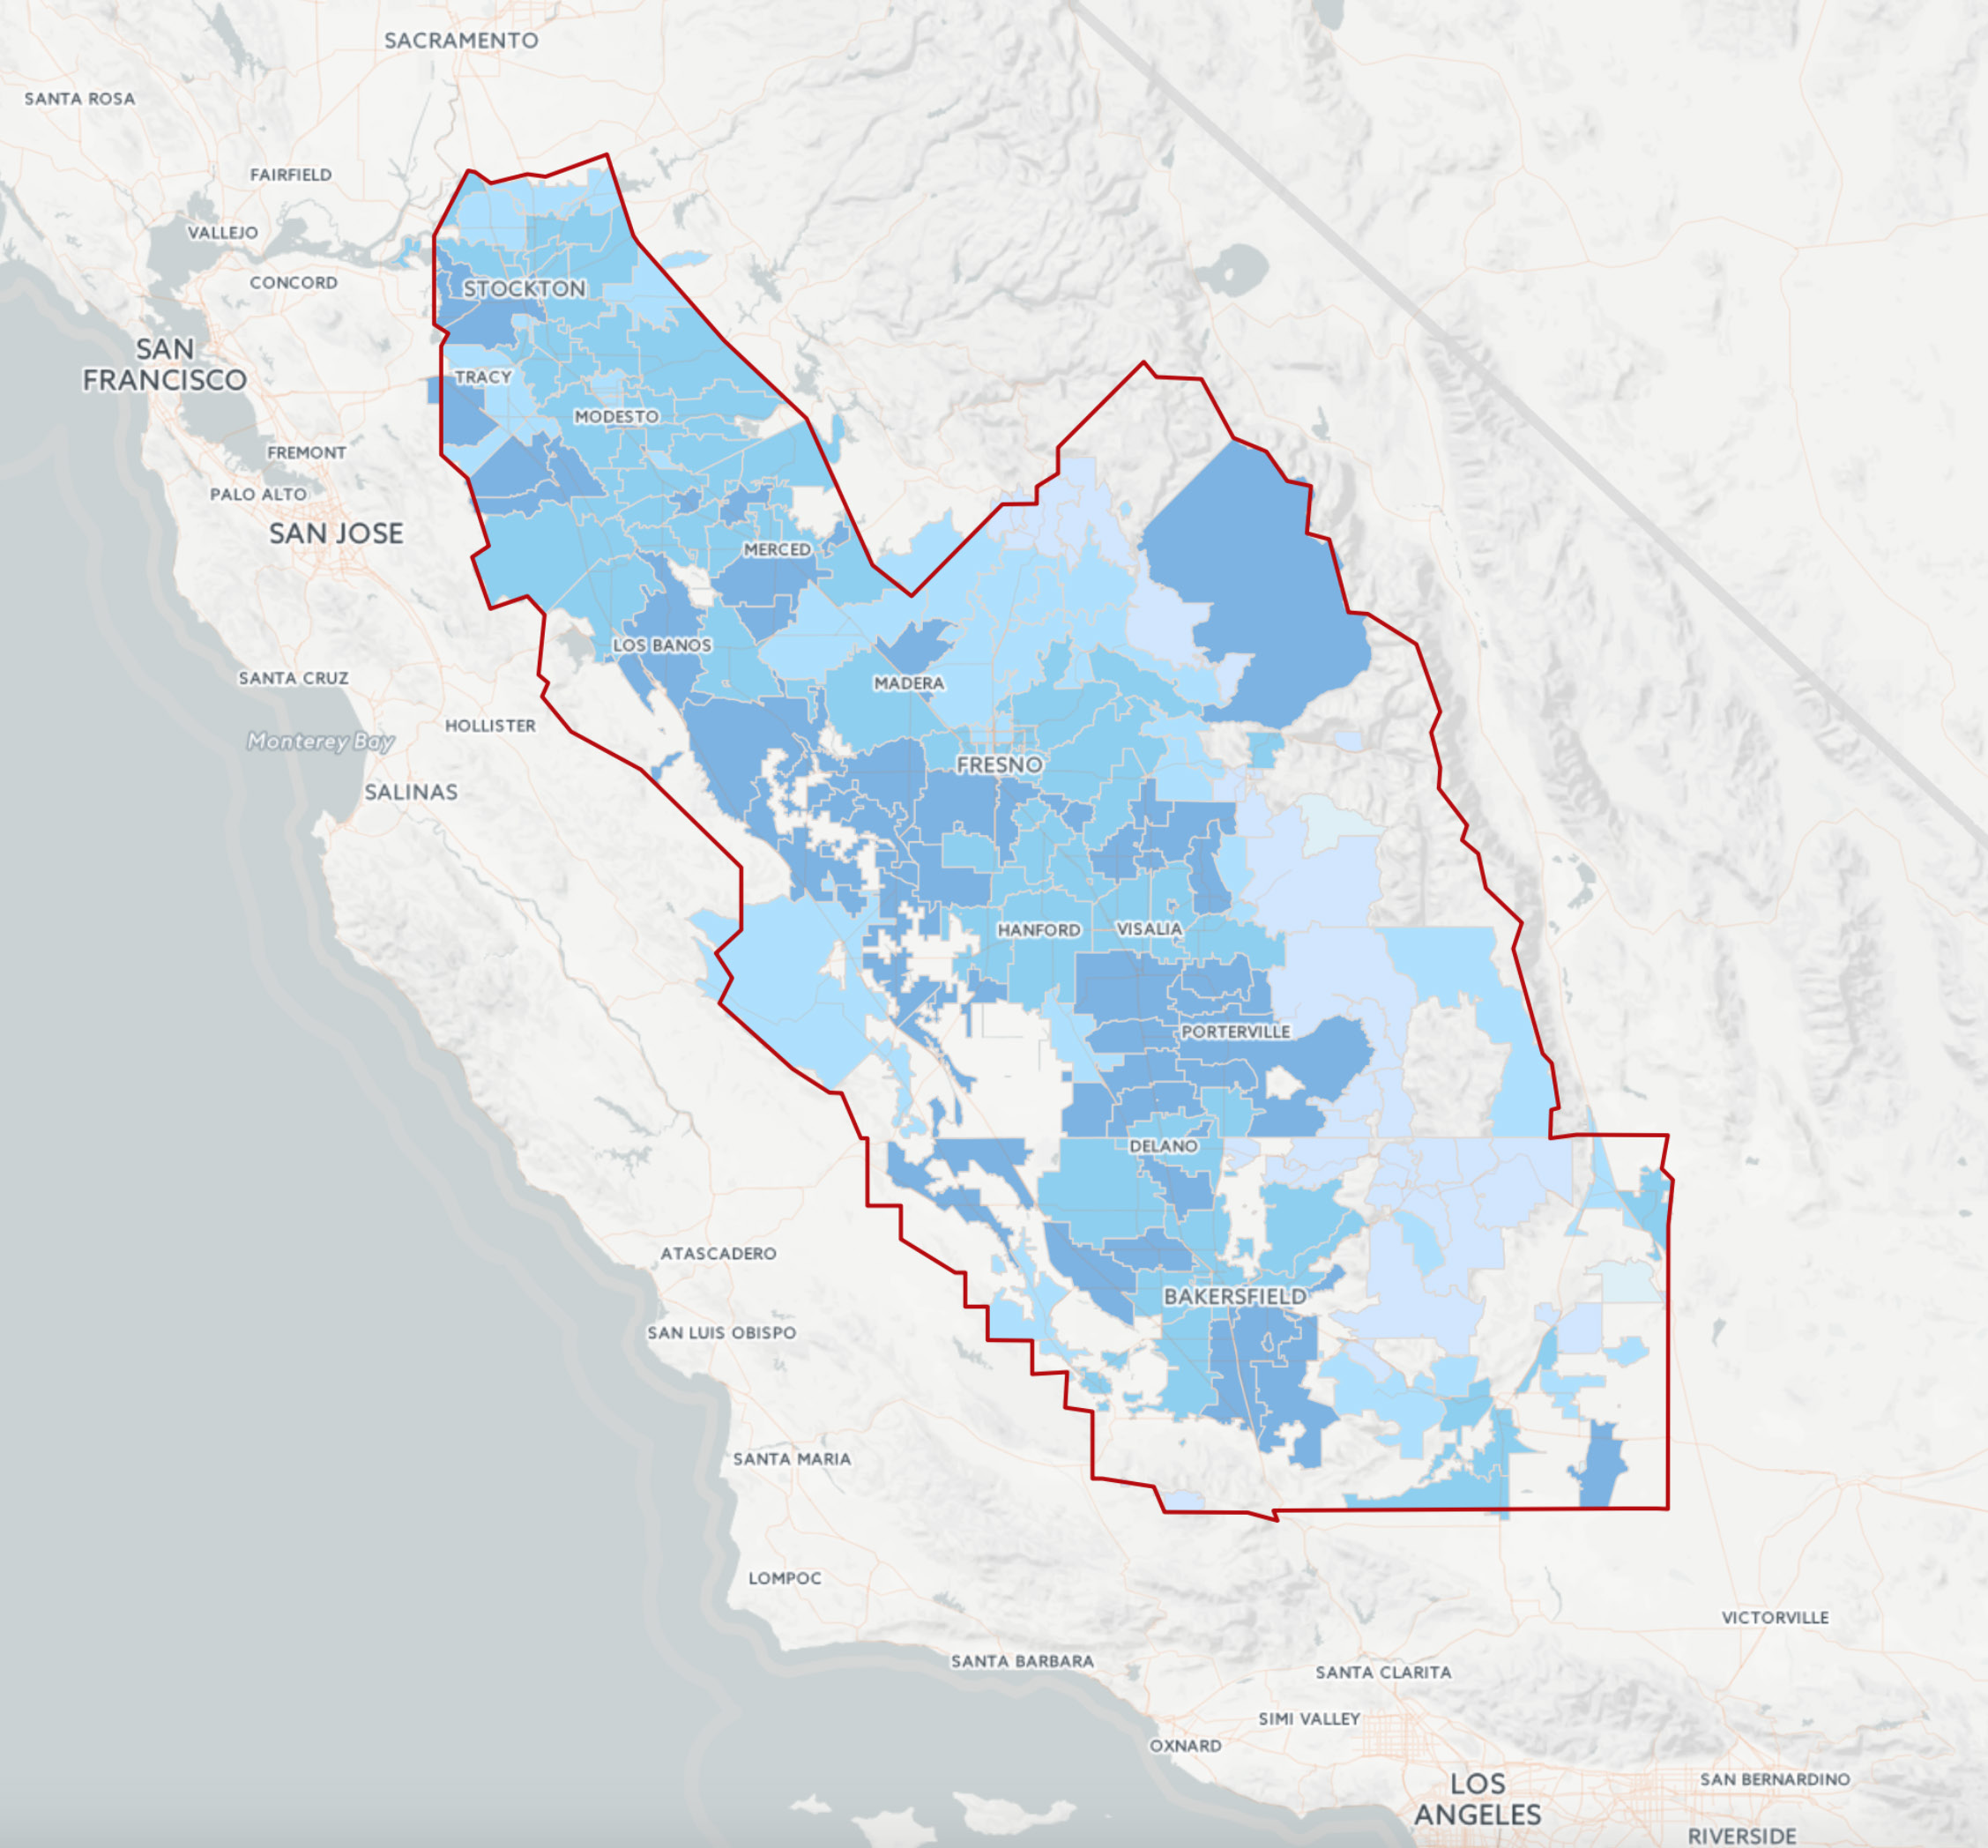

Map of California and the San Joaquin Valley showing the distribution, by zip code, of the percentage of residents under 18 years of age. The highest quartile represents populations with more than 27.3% youth; three zip codes within the SJV exceed 40%. A lighter-to-darker blue scale indicates a lower-to-higher percentage of youth.
Rates of Childhood Morbidity and Mortality in the SJV

Percentage of Population Younger than 19 Years of Age Children in the SJV are far more likely to be hospitalized for preventable illnesses than children from other regions in California. Table 2 presents childhood morbidity and mortality stratified by race/ ethnicity in the SJV. In general, preventable ED rates are higher than non-preventable and the opposite is true for that of hospital admissions. Regardless of the type of event listed in Table 2, African-Americans are either the highest or the second highest subgroup at risk. For instance, African-Americans are at highest risk for all categories of ED visits (preventable 114/1,000 and non-preventable 67/1,000), preventable hospital admissions (130/10,000), and childhood mortality (24/100,000). Rates of infant mortality are highest among African-Americans (13.3/1,000 live births) and “Others” (14.9/1,000 live births). These two subgroups are at more than double the risk of infant mortality than the next leading race (white at 5.3/1,000 live births).
Across event categories, Hispanic rates tend to be similar or lower than those of whites. For non-preventable hospital admissions, however, there is a 50% increase in the white (273/10,000) rate compared to that of Hispanics (183/10,000). More notably, the frequency of Hispanic events across categories is unparalleled in the SJV. For example, from 2009 to 2010 there were 420 Hispanic infant deaths, accounting for more than 54% of all infant deaths in the SJV in this time period. This is more than double the amount of white infant deaths (177), the second most frequent.
| Indicator | White | Hispanic | African-American | Asian | Other |
|---|---|---|---|---|---|
| Emergency Department (a) | |||||
| Preventable | 68 | 69 | 103 | 26 | 25 |
| Non-Preventable | 46 | 38 | 60 | 18 | 15 |
| Hospital Admission (b) | |||||
| Preventable | 99 | 69 | 116 | 85 | 23 |
| Non-Preventable | 273 | 181 | 222 | 199 | 61 |
| Infant Mortality (c) | 532 | 530 | 1,347 | 358 | 1,439 |
| Childhood Mortality (d) | 18 | 14 | 24 | 16 | 5 |
a = Emergency department rates are calculated per 1,000 in the population. N is the frequency of events in 2009-2011.
b = Hospital admission rates are calculated per 10,000 in the population. N is the frequency of events in 2009-2011.
c = Infant mortality includes all deaths (N) occurring under one year of age in 2009 and 2010. Rates were calculated per 100,000 live births.
d = Childhood mortality includes all deaths (N) occurring between 1 - 14 years of age in 2009 and 2010. Rates were calculated per 100,000 in the population.
Rates of Childhood Morbidity and Mortality in the SJV Counties

Table 3 outlines morbidity and mortality between the eight SJV counties. This table demonstrates that Madera (100/1,000), Merced (96/1,000), and Kings (91/1,000) have the highest rates of preventable ED visits among the SJV counties. Madera, Merced, and Kings have an increased rate of 63%, 57%, and 49% in preventable ED visits compared to the SJV as a whole, respectively. The highest risk of preventable hospital admission is found among Fresno, San Joaquin, and Stanislaus with an increase of 32%, 18%, and 15% compared to the SJV as a whole. Rates of infant mortality are highest among Fresno (6.5/100,000), Kern (5.8/100,000), and Stanislaus (5.7/100,000). Mortality rates between the ages of one and fourteen varied little between counties with highest and lowest being Kings (21/100,000) and Merced (12/100,000), respectively.
| Indicator | SJV | Fresno | Kern | Kings | Madera | Merced | San Joaquin | Stanislaus | Tulare |
|---|---|---|---|---|---|---|---|---|---|
| Emergency Department (a) | |||||||||
| Preventable | 61 | 73 | 69 | 91 | 100 | 96 | 51 | 82 | 63 |
| Non-Preventable | 36 | 42 | 37 | 47 | 60 | 49 | 37 | 50 | 39 |
| Hospital Admission (b) | |||||||||
| Preventable | 70 | 93 | 71 | 62 | 77 | 78 | 83 | 81 | 74 |
| Non-Preventable | 181 | 226 | 195 | 197 | 248 | 198 | 205 | 203 | 191 |
| Infant Mortality (c) | 586 | 661 | 609 | 568 | 585 | 554 | 592 | 609 | 555 |
| Childhood Mortality (d) | 14 | 16 | 17 | 21 | 16 | 12 | 15 | 17 | 16 |
Note. SJV denotes the San Joaquin Valley region. N is the frequency of event over the period of observation.
a = Emergency department rates are calculated per 1,000 in the population. N is the frequency of events in 2009-2011.
b = Hospital admission rates are calculated per 10,000 in the population. N is the frequency of events in 2009-2011.
c = Infant mortality includes all deaths (N) occurring under one year of age in 2009 and 2010. Rates were calculated per 100,000 live births.
d = Childhood mortality includes all deaths (N) occurring between 1 - 14 years of age in 2009 and 2010. Rates were calculated per 100,000 in the population.
Childhood Morbidity in the SJV
Table 4 outlines the most common conditions and rates of ED visits by the preventable and non-preventable categorization. The rate of preventable ED visits in the SJV is over twice the rate of non-preventable conditions. Further 86% of the non-preventable and 89% of preventable admissions are related to respiratory distress. This may reflect the extreme rates of ozone and particulate given that 22 out of the 30 zip codes with the highest rates of air and water pollution in California are located in the SJV (CalEnviroScreen 1.0, OEHHA). The rate of ED visitation for acute respiratory infection alone (33.3/1,000) is higher than the total of top ten non-preventable ED visits (28.2/1,000.)
| Indicator | Rate | % |
|---|---|---|
| Non-Preventable (ICD-9-CM) | ||
| Croup syndrome (464.4) | 5.3 | 0.2 |
| Acute bronchitis (466.0) | 4.8 | 0.2 |
| Acute bronchiolitis due to other infectious organisms (466.19) | 4.5 | 0.2 |
| Bronchitis, not specified as acute or chronic (490) | 4.3 | 0.2 |
| Fever (780.60) | 4.0 | 0.1 |
| Flu with respiratory manifestations (487.1) | 1.9 | 0.1 |
| Acute bronchiolitis due to respiratory syncytial virus (466.11) | 1.2 | 0.0 |
| Nasal cavity and sinuses (478.19) | 0.9 | 0.0 |
| Viral infection (79.99) | 0.8 | 0.0 |
| Chronic sinusitis (473.9) | 0.7 | 0.0 |
| Total Non-Preventable | 28.2 | 1.0 |
| Preventable | ||
| Acute upper respiratory infection (465.9) | 33.3 | 0.5 |
| Acute pharyngitis (462) | 9.4 | 0.1 |
| Pneumonia (486) | 7.0 | 0.1 |
| Otitis media (382.9) | 6.7 | 0.1 |
| Asthma acute exacerbation (493.92) | 3.5 | 0.1 |
| Asthma (493.90) | 3.5 | 0.1 |
| Acute tonsillitis (463) | 2.8 | 0.0 |
| Extrinsic asthma (493.00) | 1.3 | 0.0 |
| Extrinsic asthma with acute exacerbation (493.02) | 1.0 | 0.0 |
| Febrile convulsions (780.31) | 0.5 | 0.0 |
| Total Preventable | 69.0 | 1.0 |
Note. Emergency Department rates are computed per 1,000. Population estimates from the 2010 Census were used to extrapolate over the three-year period. Percentages reported in this table only include the top ten diagnoses, not all preventable and non-preventable conditions.

The majority of hospitalizations (54%) are admitted through the ED and represent a proportion of children with more advanced conditions, requiring substantial observation and medical support from highly trained medical staff. Table 5 compares hospitalization rates for the listed conditions to the remaining regions of California as well as California as a whole. In general, rates of preventable hospitalizations are 11% higher in the SJV than in California. This is likely due to the elevated rates of respiratory illness in the SJV. Primarily, SJV rates of extrinsic asthma with acute exacerbation are 3 times higher than California’s rates. This trend is also present in non-preventable illnesses—acute bronchiolitis represents 21.7% of hospitalizations in the SJV and only 13.1% for the remaining regions in California
| Indicator — Diagnosis (ICD-9-CM) | San Joaquin Valley | Rest of California | California | |||
|---|---|---|---|---|---|---|
| Rate | % | Rate | % | Rate | % | |
| Non-Preventable | ||||||
| Acute bronchiolitis due to respiratory syncytial virus (466.11) | 12.9 | 21.7% | 7.9 | 13.1% | 8.5 | 14.2% |
| Fetal and neonatal jaundice (774.6) | 11.1 | 18.6% | 11.3 | 18.7% | 11.2 | 18.7% |
| Acute appendicitis without peritonitis (540.9) | 10.3 | 17.3% | 20.1 | 33.4% | 18.8 | 31.4% |
| Acute bronchiolitis due to other infectious organisms (466.19) | 7.1 | 11.8% | 7.5 | 12.5% | 7.5 | 12.5% |
| Fever (780.60) | 3.9 | 6.6% | 2.8 | 4.6% | 2.9 | 4.9% |
| Acute appendicitis with generalized peritonitis (540.0) | 3.8 | 6.4% | 3.6 | 6.0% | 3.7 | 6.1% |
| Respiratory distress syndrome (769) | 3.6 | 6.1% | 1.4 | 2.4% | 1.7 | 2.9% |
| Closed supracondylar fracture of humerus (812.41) | 2.3 | 3.9% | 2.7 | 4.5% | 2.7 | 4.4% |
| Transitory tachypnea of newborn (770.6) | 2.3 | 3.8% | 0.9 | 1.5% | 1.1 | 1.8% |
| Viral Infection (79.99) | 2.2 | 3.7% | 1.9 | 3.1% | 1.9 | 3.2% |
| Total Non-Preventable | 59.6 | 100.0% | 60.2 | 100.0% | 60.1 | 100.0% |
| Preventable | ||||||
| Pneumonia (486) | 20.0 | 36.8% | 15.6 | 36.0% | 16.2 | 36.1% |
| Extrinsic asthma with acute exacerbation (493.02) | 7.3 | 13.4% | 1.9 | 4.3% | 2.6 | 5.7% |
| Dehydration (276.51) | 7.0 | 12.9% | 5.6 | 13.0% | 5.8 | 12.9% |
| Asthma acute exacerbation (493.92) | 5.7 | 10.4% | 6.3 | 14.5% | 6.2 | 13.9% |
| Urinary tract Infection (599.0) | 4.5 | 8.2% | 3.0 | 6.9% | 3.2 | 7.1% |
| Acute upper respiratory infection (465.9) | 2.3 | 4.3% | 2.6 | 6.1% | 2.6 | 5.8% |
| Noninfectious gastroenteritis and colitis (558.9) | 2.2 | 4.0% | 2.7 | 6.2% | 2.6 | 5.8% |
| Cellulitis and abscess of buttock (682.5) | 1.9 | 3.5% | 1.2 | 2.7% | 1.3 | 2.8% |
| Pyelonephritis; kidney infection (590.80) | 1.8 | 3.4% | 2.4 | 5.4% | 2.3 | 5.1% |
| Asthma with status asthmaticus (493.91) | 1.7 | 3.2% | 2.2 | 5.0% | 2.1 | 4.7% |
| Total Preventable | 54.3 | 100.0% | 43.4 | 100.0% | 44.8 | 100.0% |
Note. Hospital admission rates are computed per 10,000. Population estimates from the 2010 Census were used to extrapolate over the three-year period. Percentages reported in this table only include the top ten diagnoses, not all preventable and non-preventable conditions.
Race/Ethnicity, Age, and Neighborhood Poverty on Childhood Morbidity in the SJV
Analysis was conducted to evaluate the effects of individual race/ethnicity and neighborhood poverty on children’s ED visits. Between the years 2009 and 2011 for the SJV region, African-Americans had the highest rate of preventable ED visits 114 per 1,000 (n = 14,041) and the lowest rate was observed in Asian/Pacific Islanders, 19 per 1,000 (n = 3,499).
In Figure 2, ED rates are separated by quintiles of poverty and race/ethnicity. This figure illustrates that all racial/ethnic groups are influenced by poverty. In the highest quintile of poverty whites (152/1,000) have the highest rate of ED utilization followed by African-Americans (123/1,000). In the most affluent neighborhoods (lowest level of poverty) African-Americans (67/1,000) have the highest rate of preventable ED usage followed by Hispanics (35/1,000). Asians/Pacific Islanders tend to have the lowest rates of ED visits throughout the levels of poverty with a high of 26/1,000.
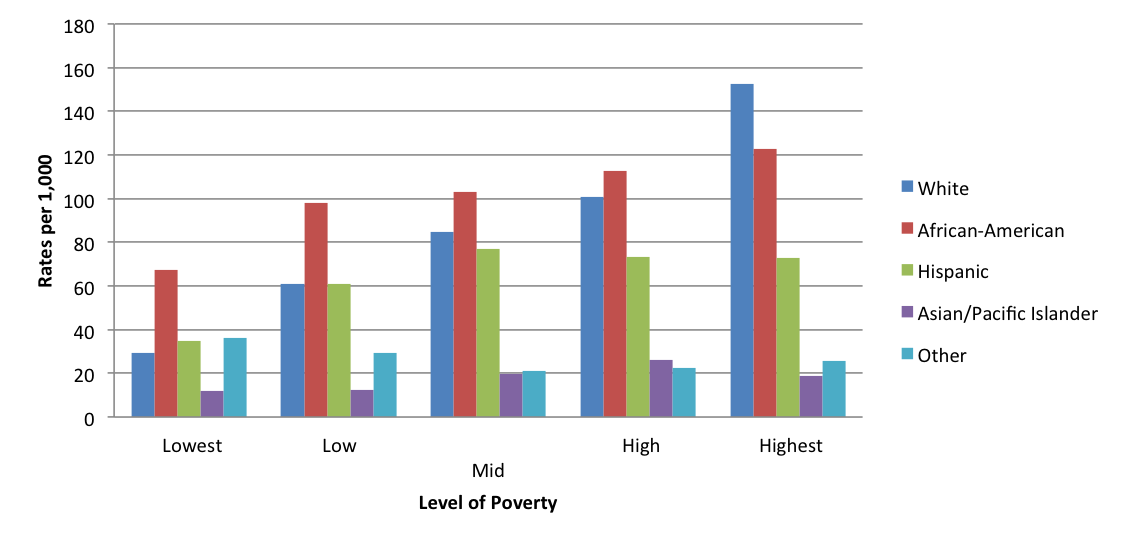
Grouped column chart with poverty quintiles Lowest, Low, Mid, High, Highest and groups White, African-American, Hispanic, Asian/Pacific Islander, Other. The vertical axis reads rate per 1,000. Rates generally increase with poverty. The text reports that at highest poverty, White (152 per 1,000) and African-American (123 per 1,000) have the highest rates in this comparison. The source caption uses “Hospital Admissions” although the surrounding discussion describes emergency department visits.
Figure 3 illustrates the rates of preventable hospital admissions by individual race/ethnicity and neighborhood poverty. Similar to ED visits—hospital admissions tend to increase with the level of poverty. In the highest level of poverty whites (236/10,000) have the highest rate followed by African-Americans (147/10,000) and Asians/Pacific Islanders (79/10,000). The “Other” race/ethnicity sub-group has the lowest overall rate of preventable hospital admission of 12 per 10,000 which is found in the highest level of poverty.
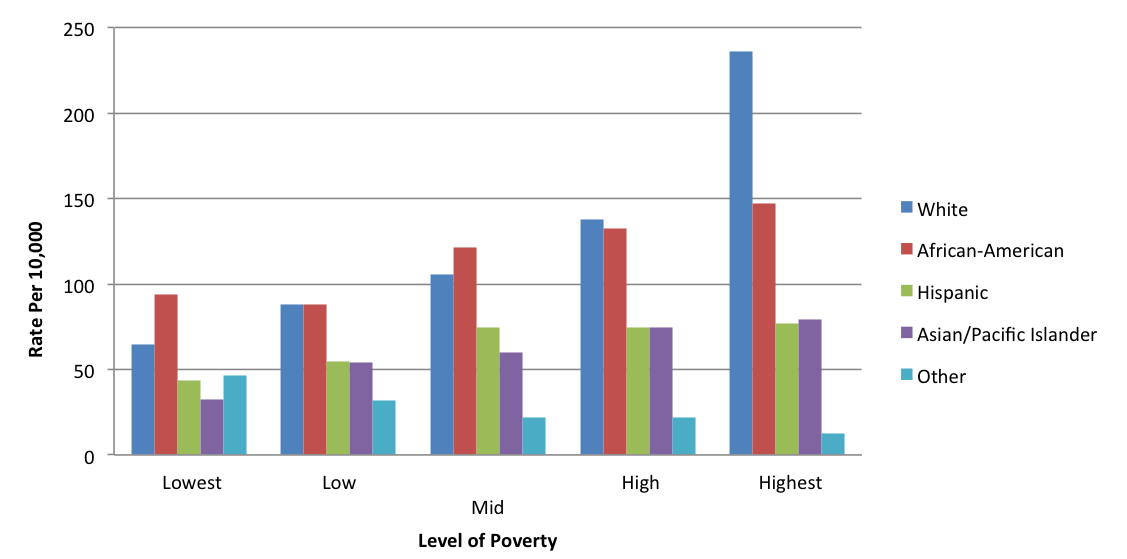
Grouped column chart with poverty quintiles Lowest, Low, Mid, High, Highest; White, African-American, Hispanic, Asian/Pacific Islander, and Other. The vertical axis reads rate per 10,000. Bars are generally highest in high-poverty neighborhoods. The adjacent text reports White (236 per 10,000), African-American (147 per 10,000), Asian/Pacific Islander (79 per 10,000), and Other (12 per 10,000) in the highest poverty quintile. The figure caption uses “ED Visits” although its surrounding text refers to hospital admissions.
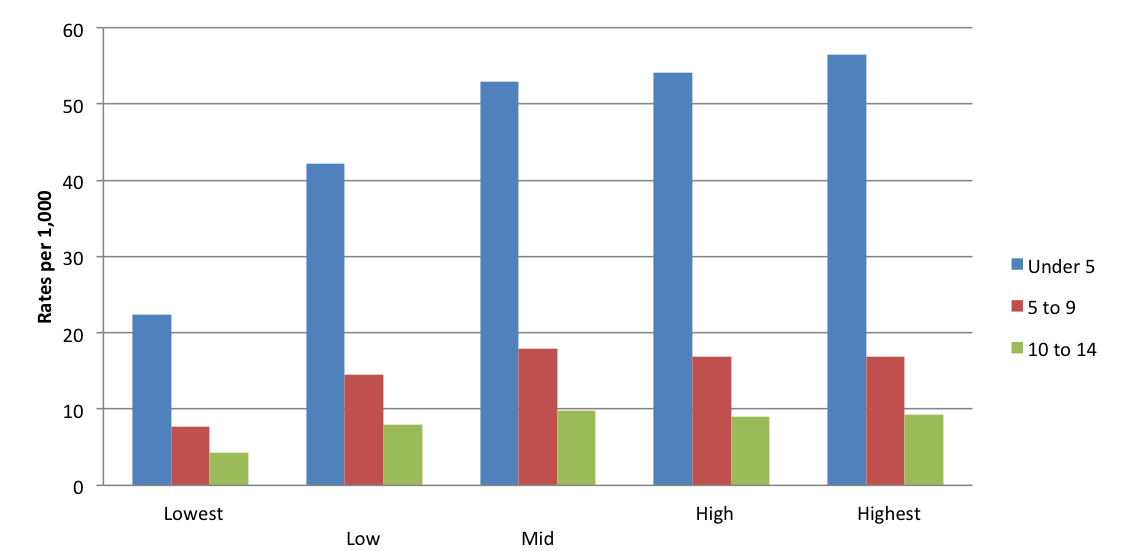
Grouped column chart for children Under 5, 5 to 9, and 10 to 14 years by quintiles of neighborhood poverty: Lowest, Low, Mid, High, Highest. The vertical axis reads rate per 1,000. Children under five have the highest rates at every poverty level, increasing with poverty; rates for children aged 10 to 14 are the lowest.
In Figure 4, rates of preventable ED visits are distributed by level of poverty and the individuals’ age group. Children under five years of age living in the highest level of poverty have the highest rate of ED visits (56/1,000). Of all preventable ED visits, 65% are in the age group under five and within every level of poverty this age group has the highest rate of usage. The same is true of preventable hospitalization rates (see Figure 5). In Figure 5, the level of poverty tends to increase the risk of a preventable hospitalization regardless of the age group. Most notably children under five are most affected by the level of poverty increasing by 60% from the lowest level to the highest. The oldest age group, 10 to 14 years of age, has the lowest rates of preventable hospitalizations across all levels of poverty.
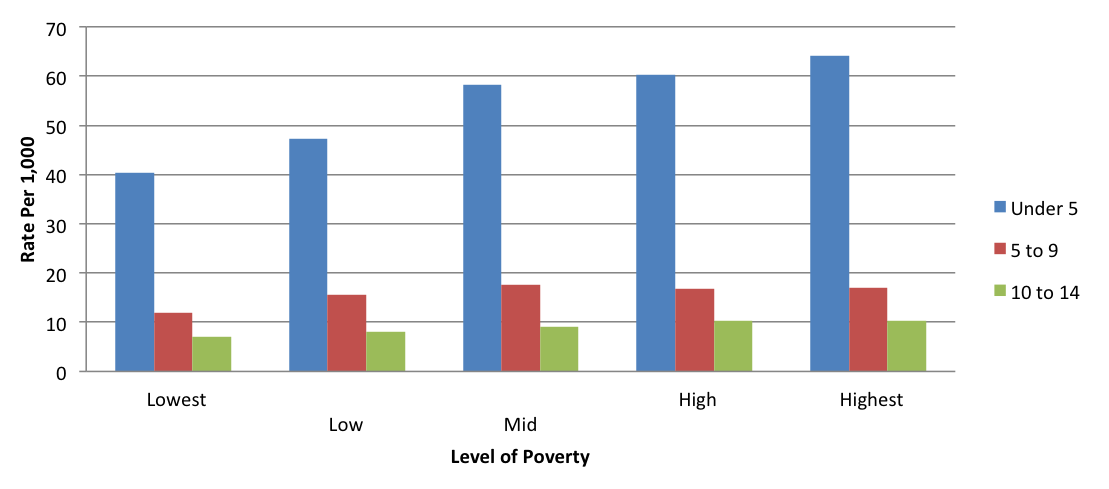
Grouped column chart for Under 5, 5 to 9, and 10 to 14 years by the Lowest, Low, Mid, High, and Highest neighborhood poverty quintiles. The vertical axis reads rate per 1,000. In each poverty quintile the under-five group has the highest rate, and the youngest group increases from approximately 40 to more than 60 per 1,000 across poverty levels.

Finally, rates of mortality are evaluated by individual race/ethnicity, age and neighborhood poverty (Figure 6). A total of 1,087 deaths under the age of 15 were recorded between 2009 and 2010. Of all childhood deaths 82.1% were of children under the age of five and of those deaths 83.8% occurred under one year of age. The highest rates of mortality occur for children under 5 in communities with the highest rates of poverty. The older age group suffered a total of 163 deaths in the SJV, composing 14.9% of all childhood deaths. Childhood mortality rates of whites and Hispanics are similarly affected by poverty, as both rates increase as the level of poverty increases. The rate of death in African-American children is lowest in the neighborhoods with the lowest level of poverty. Children under 5 experience higher rates of mortality than Non-Hispanic white children in communities with the largest disparity in neighborhoods with highest rates of poverty. Within every level of poverty, African-Americans and children under 5 years of age have the highest rates of mortality.
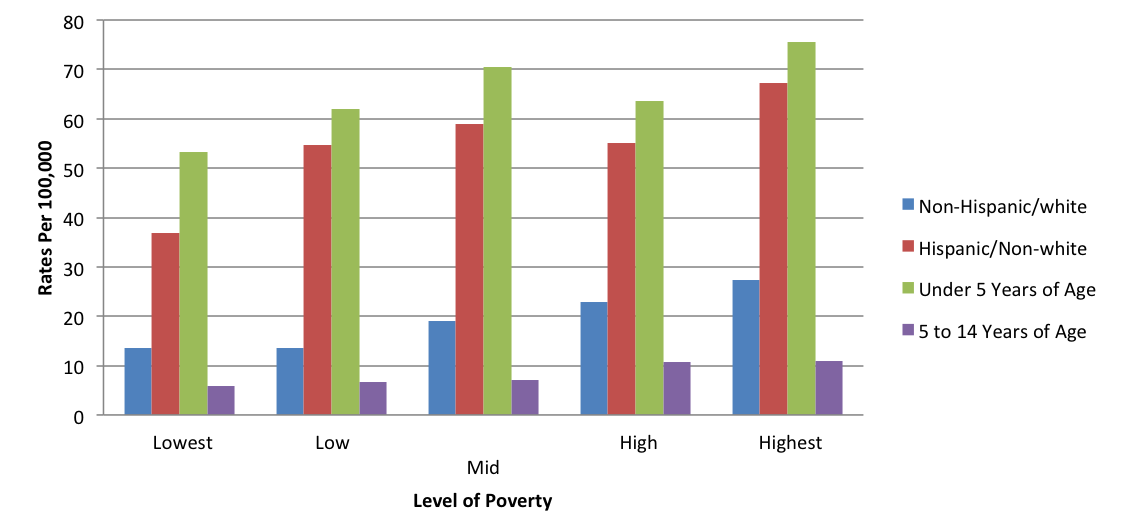
Grouped column chart of mortality rate per 100,000 across the Lowest, Low, Mid, High, and Highest levels of poverty. The groups are Non-Hispanic/white, Hispanic/non-white, Under 5 Years of Age, and 5 to 14 Years of Age. Mortality rates for the Under 5 group are highest in each quintile. The neighboring text reports 1,087 deaths under age 15 in 2009–2010, 82.1% involving children younger than five.
Other Neighborhood Determinants of Childhood Morbidity in the SJV
While the above analyses indicate that individual race/ ethnicity and neighborhood poverty are key factors in understanding the elevated rates of childhood morbidity and mortality in the San Joaquin Valley, they provide few clues on the life experiences and potentially modifiable risk factors. In order to better understand other neighborhood determinants of childhood morbidity, a multivariate analysis examined individual and neighborhood predictors of preventable childhood hospitalization. Details on the methods and findings for these analyses are presented in Appendix A. US Census Data was used to incorporate zip-code level factors including segregation and poverty rates. The pollution burden score was calculated by the California Office of Environmental Health Hazard Assessment using 11 indicators. Poisson-based negative binomial regression was used for final analysis and stratification of sample by race/ethnicity and age was also incorporated. Ultimately, a 31% reduction in preventable disease hospitalizations for children under 15 living in low poverty compared to those living in high poverty was found. With every unit increase in pollution burden, hospitalizations rates increase by 25%, 20%, and 20% in age groups under 1, 1-4 and 5-14, respectively. In most sub-groups of age and race/ethnicity, hospitalizations increased as neighborhoods became more racially diverse.
These results provide important insights on the social determinants of childhood preventable illness in the SJV in that they allow identification of neighborhoods where living conditions create greater and lesser risks for children. In Figure 7, the spectrum of poverty and diversity in the SJV is illustrated. This map illustrates where the highest to the lowest concentrations of poverty and racial diversity have clustered into neighborhoods. The average community in the SJV valley, on this scale, represents those neighborhoods within one standard deviation of the mean (n = 136). On the high end of the spectrum community clusters (n = 37) of the highest rates of poverty and racial diversity are identified. In these neighborhoods rates of poverty are one standard deviation above the mean of the SJV, and the probability of interaction between Hispanics, African-Americans, Asians/Pacific Islanders, and other race subgroups is high. On the low end of Figure 7, the most affluent and racially segregated neighborhoods are identified (n = 24). In these neighborhoods the lowest rates of poverty and diversity are observed.
In Table 6 neighborhood characteristics are tabulated by the three geographic regions depicted in Figure 8. In general, there are substantial differences between the three levels of poverty and diversity. The twenty-four communities in the low poverty and diversity subgroup have the lowest values of population density (M = 133), pollution (M =3.4), and percent Hispanic (M = 16.4). These communities have the highest values of household income (M = 60,851), commute time to work (M = 29.2), and population over 64 years of age (M = 20.2). In the thirty-seven communities of high poverty and diversity a different set of community characteristics emerges, as shown in Table 6. The top panel in Table 6 highlights characteristics that are significantly different between the highest level and the other two levels of poverty and diversity. For example, the CES score, which is an index of both the pollution burden and population characteristic scores of the CalEnviroScreen 1.0 is significantly higher (M = 42.9) in neighborhoods of high poverty and diversity compared to those that are of average (M = 32.7) or low (M = 14.0) poverty and diversity.
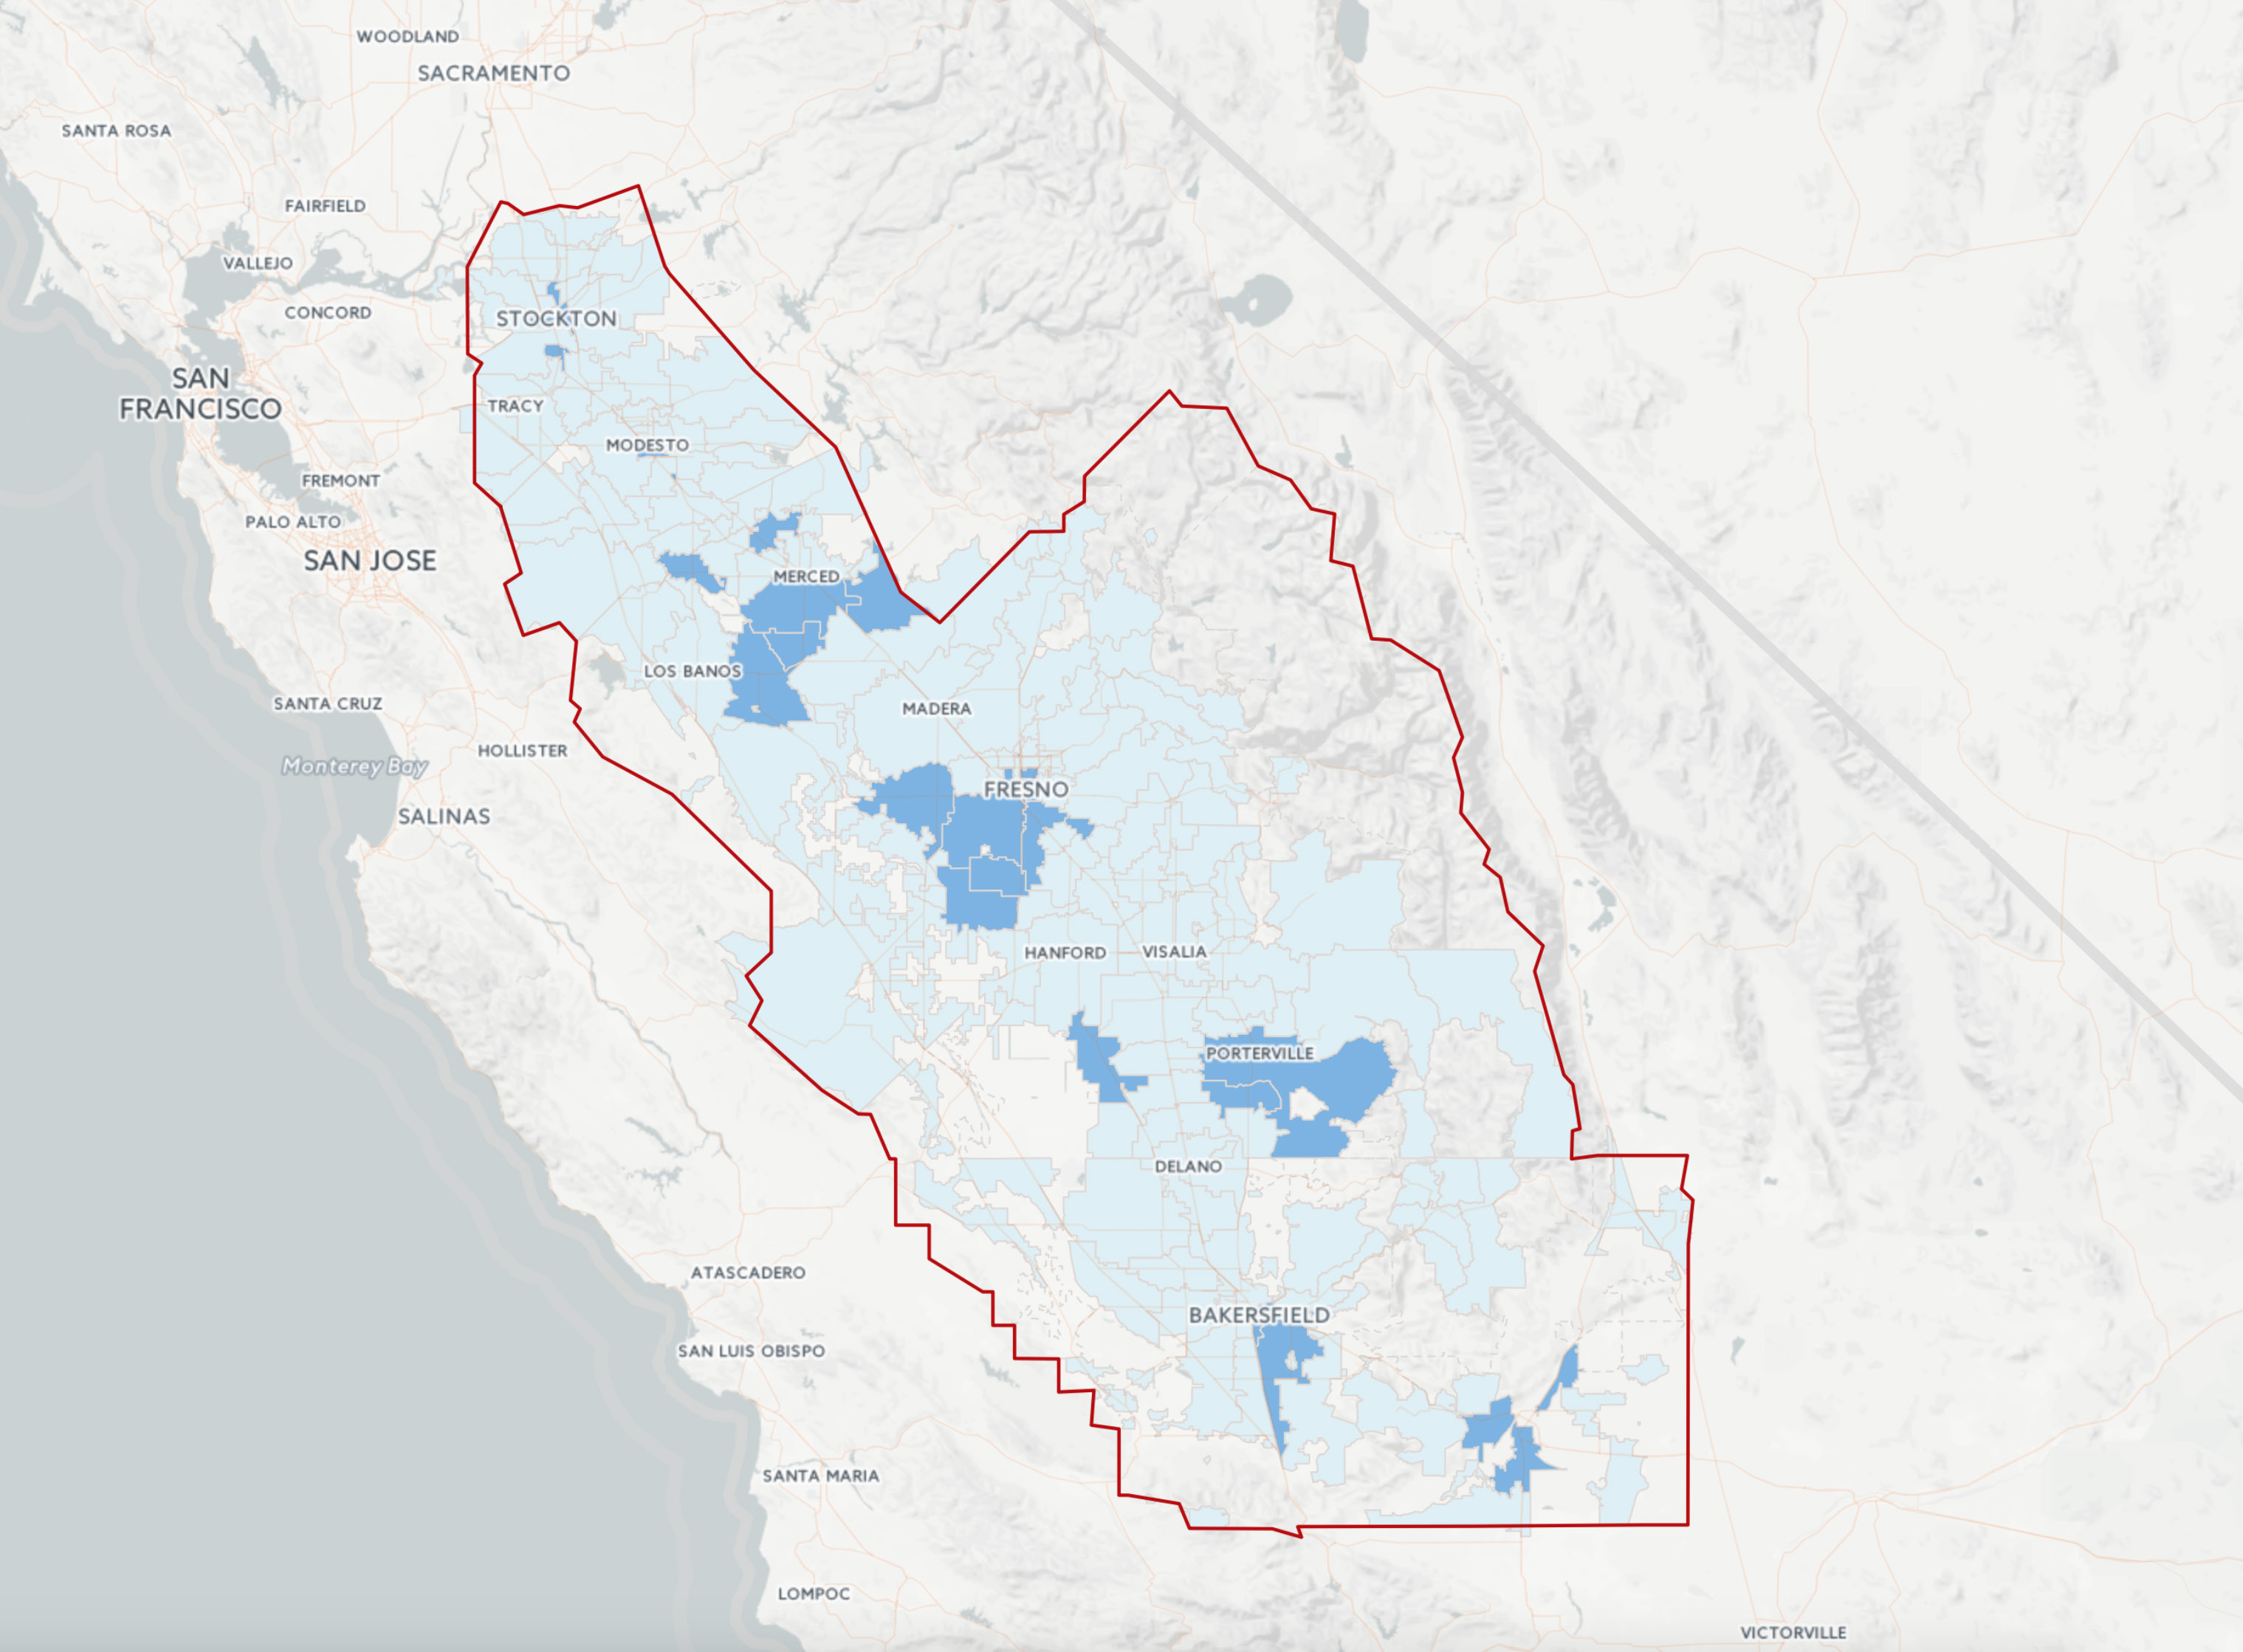

San Joaquin Valley zip-code map with blue shading of combined poverty and racial diversity, ordered from lower to higher levels. The report distinguishes 24 low-poverty/low-diversity neighborhoods, 136 average-poverty/diversity neighborhoods, and 37 high-poverty/high-diversity neighborhoods.
Similarly, these neighborhoods have the highest values of population density (M = 2,756), healthcare facilities (M = 1.8), African-Americans (M = 6.6), and renters (55.4). Conversely, neighborhoods of low poverty and diversity have the highest values of whites (M = 71.2) and new homes (M = 59.0).
| Indicator | High Poverty and Diversity (N = 37) | Average Poverty and Diversity (N = 136) | Low Poverty and Diversity (N = 24) | |||
|---|---|---|---|---|---|---|
| Mean | Standard Deviation | Mean | Standard Deviation | Mean | Standard Deviation | |
| CalEnviroScreen Score | 42.9 | 11.4 | 32.7 | 10.3 | 14.0 | 6.7 |
| Population Density | 2,756 | 2,991 | 1,134 | 1,851 | 133 | 273 |
| Number of Healthcare Facilities | 1.8 | 1.6 | 1.1 | 1.1 | 0.6 | 0.7 |
| Median Household Income | 33,897 | 7,241 | 47,509 | 16,710 | 60,821 | 19,765 |
| % New Homes | 20.4 | 11.8 | 35.1 | 18.8 | 59.0 | 17.3 |
| % African-American | 6.6 | 5.2 | 3.2 | 3.4 | 1.0 | 1.1 |
| % White | 24.6 | 10.5 | 36.0 | 22.5 | 71.2 | 19.5 |
| % Renter | 55.4 | 13.8 | 43.1 | 14.9 | 27.4 | 20.5 |
| Pollution Burden Score | 5.5 | 1.1 | 5.2 | 1.4 | 3.4 | 1.5 |
| Commute Time in Minutes | 23.1 | 3.5 | 25.1 | 6.1 | 29.2 | 7.1 |
| % High School Diploma | 59.5 | 9.2 | 68.0 | 19.1 | 87.6 | 10.6 |
| % Under 15 | 25.3 | 5.6 | 24.4 | 5.9 | 16.7 | 6.5 |
| % Over 64 | 9.6 | 3.2 | 9.6 | 4.7 | 20.2 | 9.9 |
| % Hispanic | 59.7 | 12.0 | 52.6 | 25.7 | 16.4 | 13.0 |
| % in Labor Force | 54.4 | 10.8 | 60.5 | 9.0 | 55.4 | 7.9 |
Note. One-way ANOVA’s and post-hoc t-tests were used to identify significant differences between groups. Rows highlighted in yellow indicate statistically significant differences between the high poverty and diversity level and the other two levels. Rows highlighted in green indicate statistical differences between high poverty and diversity and low poverty and diversity. Rows highlighted in blue indicate statistical differences between high poverty and diversity and average poverty and diversity.
Costs of Childhood Morbidity in the SJV
A variety of neighborhood characteristics have been used to illustrate geographic regions that are burdened with a greater amount of disparity than others. A detailed discussion of how neighborhoods took shape in the SJV has been outlined elsewhere (see San Joaquin Valley Fair Housing and Equity Assessment), and readers are encouraged to gain knowledge on the history of the SJV.
Cost analysis is important for understanding the social and economic burden of disease disproportionately impacting underserved communities with young children. As described earlier, ED and hospital model estimates were developed to evaluate the impact of race and poverty on preventable pediatric illness. Three categories were created: low poverty, white, and low poverty/white (as described previously).
Table 7 highlights the reduction in cost that would occur if all children in the SJV had preventable ED visitation rates equal to those of children in low poverty communities, white children and white children living in communities with low poverty. If all children had rates similar to those from low poverty communities, there would be a decrease in total expenditures of $9.2 million per year, or a reduction of 36.4%. If all children had rates similar to those of white children, there would a savings of $13.8 million, or a 54.3% reduction in costs. If all children experienced rates enjoyed by white children living in communities with low poverty, a substantial $19.2 million would be saved, a total reduction of 75.8% in ED costs.
| Adjustment | Event Ratio | % Reduction in Cost | Estimated Savings Per Year |
|---|---|---|---|
| Low Poverty | 1.57 | 36.4 | $9,241,936 |
| White | 2.19 | 54.3 | $13,807,730 |
| Low Poverty and White | 4.13 | 75.8 | $19,269,649 |
Similar findings are evident when considering preventable pediatric hospitalizations. Table 8 highlights the reduction in cost that would occur if all children in the SJV had preventable hospitalization rates equal to those of children in communities of low poverty, white children and white children living in low poverty communities. If all children were hospitalized at the same frequency as those living in low poverty communities, there would be a decrease in total expenditures of $8.8 million per year, or a reduction of 28.8%. If all children had rates similar to those of white children, there would a savings of $12.8 million, or a 42% reduction in costs. If all children experienced rates of hospitalization similar to those from white children living in low poverty communities, a substantial $19.1 million would be saved, a total reduction of 62.3% in direct hospitalization costs.
| Adjustment | Event Ratio | % Reduction in Cost | Estimated Savings Per Year |
|---|---|---|---|
| Low Poverty | 1.40 | 28.8 | $8,838,453 |
| White | 1.72 | 42.0 | $12,889,520 |
| Low Poverty and White | 2.65 | 62.3 | $19,113,621 |
Discussion and Recommendations
As defined by the World Health Organization, social determinants of health are the “conditions in which people are born, grow, live, work and age.”24 These conditions are shaped by the unequal distribution of resources, primarily economic, political and social capital. Social determinants are largely responsible for the health inequities highlighted throughout this report. Health inequities constitute the unfair and avoidable differences in health status seen in communities with fewer resources to address the sources of ill health and stress residents encounter.
In the SJV, social determinants of health are limiting the health and economic future of children and perpetuating the struggle of working poor families. In this report, findings indicate that children that are non-white and underserved are likely experiencing less access to preventable care, more stressful and harmful neighborhood environments and have fewer resources to address conditions that develop-earlier in their lives. The ramifications of these disparities extend beyond the individual child and family unit. Racial and economic differences account for a substantial portion of elevated costs for these populations. It should be a public health priority to participate in efforts to eliminate poverty and focus research on family health status and health care access.
Furthermore, the children most at risk of experiencing these conditions are non-white, particularly those younger than age 5 with a large proportion residing in the SJV. These children appear to be more susceptible to the negative neighborhood influences that accompany low SES communities, likely due to increased stress. It is critical that county and state level policies address these disparities, an achievable goal within the context of the Affordable Care Act and the expanded national focus on maternal and child health initiatives. For example, the prevalence of many of these conditions may be reduced with increased access to child vaccination programs, particularly hospitalizations associated with pneumonia.25
Potential Initiatives to Improve Childhood Health Outcomes
County Public Health Departments play a key role in encouraging and providing leadership towards improving Maternal and Child Health equity, particularly in diverse contexts. In particular, there are three specific opportunities that Public Health Departments can champion at the county level:
-
Promote high quality and culturally responsive perinatal clinical care in patient-centered systems, informed by scientific consensus and national best practice evidence.
In the SJV, several counties are engaging in this effort by identifying and fostering opportunities to train and retain physicians and providers in other medical specialties (Nurse Practitioners, Registered Nurses, etc.) that are multi-lingual and culturally sensitive. Public Health Departments are also engaging practitioners to discuss developing new partnerships that will increase access to quality, coordinated and evidence-based care.
-
Provide individually oriented education, health promotion, screening and interventions for women of reproductive age to reduce risk factors that might affect pregnancy outcomes.
The “promotora” or community health worker (CHW) model has received significant attention recently as an opportunity to provide social, economic and health support for women. CHWs visit women in home settings to promote preventive measures including breastfeeding, nutrition, homemaker assistance, healthcare system navigation, etc. Ideally, CHWs are members of the communities in which they serve, providing both context and a role model for women in need of support. Developing and funding these programs is a high priority goal for several SJV counties.
-
Investigate and increase the responsiveness of policies and programs to social, economic and environmental factors that impact pregnancy and early childhood outcomes.
This multi-level, interdisciplinary goal requires new collaborations and unique partnerships. Some counties in the SJV are coordinating across sectors to consider the built environment and adopt health-friendly policies and improve the physical infrastructure for healthy living. Those invited to engage and frame new policies include government agencies, businesses, employers, developers, and families.
Limitations
Though evaluating principal ICD-9 codes has been used extensively to estimate burden of disease, it remains an imperfect process. ICD-9 codes are reported by a physician for billing purposes and there may be discrepancy between practitioners in terms of what is considered the most pressing health condition to report initially. Furthermore, though ACSC conditions are often used to analyze preventable hospitalizations, it is possible that some children are more likely to develop and be hospitalized for these conditions based on pre-existing comorbidities, not included in the analyses.
The possibility of multiple admissions for the same patient exists, with no way to perform a cluster analysis given that all identifiers have been removed for privacy purposes. For this reason, our analysis may overestimate actual figures. This may be one reason that hospitalization rates are so high in the SJV as compared to California—children in the Valley may be more likely to have repeat hospitalizations due to poorer overall health status or limited access to primary care. However, each hospitalization, even repeat events, disrupts the family and community, warranting evaluation.
In the present study neighborhood boundaries were determined by zip code. Zip codes were originally generated to facilitate postal services. There is no clear consensus among researchers determining the validity of zip codes as a construct of measuring common community characteristics. Due to the nature of these data analysis is limited to zip codes as the most fine-grained level of defining a neighborhood. In the future, researchers should use hierarchical linear modeling (HLM) to investigate multilevel interactions between context and composition. Use of HLM would help illuminate causal pathways of neighborhood effects on the individual.

Citations
- Haas S. The long-term effects of poor childhood health: An assessment and application of retrospective reports. Demography 2007;44:113-35.
- Hayward MD, Gorman BK. The long arm of childhood: the influence of early-life social conditions on men’s mortality. Demography 2004;41:87-107.
- O’Hara B, Caswell K. Health status, health insurance, and medical services utilization: 2010. Curr Pop Rep 2012;2012:70-133.
- California Department of Public Health: Asthma Surveillance. 2013. (Accessed 1/29/2015, at http://www.ehib.org/page.jsp?page_key=28.)
- Board R, Ryan-Wenger N. Long-term effects of pediatric intensive care unit hospitalization on families with young children. Heart & Lung: The Journal of Acute and Critical Care 2002;31:53-66.
- Russo A, Jiang HJ, Barrett M. Trends in Potentially Preventable Hospitalizations among Adults and Children, 1997-2004: Statistical Brief #36. Healthcare Cost and Utilization Project (HCUP) Statistical Briefs. Rockville (MD): Agency for Health Care Policy and Research (US); 2006.
- Lu S, Kuo DZ. Hospital charges of potentially preventable pediatric hospitalizations. Academic pediatrics 2012;12:436-44.
- Crocker DD, Kinyota S, Dumitru GG, et al. Effectiveness of home-based, multi-trigger, multicomponent interventions with an environmental focus for reducing asthma morbidity: a community guide systematic review. American journal of preventive medicine 2011;41:S5-S32.
- Chang CF, Herrod HG, Steinberg SS. Prevalence and costs of acute and chronic potentially avoidable pediatric hospitalizations in Tennessee. Tennessee medicine: journal of the Tennessee Medical Association 2009;102:35-9.
- Largent J, Nickerson B, Cooper D, Delfino R. Paediatric asthma hospital utilization varies by demographic factors and area socio-economic status. Public health 2012;126:928-36.
- Camacho-Rivera M, Kawachi I, Bennett GG, Subramanian SV. Perceptions of neighborhood safety and asthma among children and adolescents in Los Angeles: a multilevel analysis. PloS one 2014;9:e87524.
- Liu SY, Pearlman DN. Hospital readmissions for childhood asthma: the role of individual and neighborhood factors. Public health reports 2009;124:65.
- Place Matters for Health in the San Joaquin Valley: Ensuring Opportunities for Good Health for All. Washington, DC: Joint Center for Political and Economic Studies; March 2012.
- Mainous III AG, Kohrs FP. A comparison of health status between rural and urban adults. Journal of Community Health 1995;20:423- 31.
- Laditka JN, Laditka SB, Probst JC. Health care access in rural areas: evidence that hospitalization for ambulatory care-sensitive conditions in the United States may increase with the level of rurality. Health & place 2009;15:761-70.
- Reschovsky JD, Staiti AB. Access and quality: does rural America lag behind? Health Affairs 2005;24:1128-39.
- Woolf SH, Braveman P. Where health disparities begin: the role of social and economic determinants—and why current policies may make matters worse. Health affairs 2011;30:1852-9.
- Li J, Mattes E, Stanley F, McMurray A, Hertzman C. Social determinants of child health and well-being. Health Sociology Review 2009;18:3-11.
- London J, Huang G, Zagofsky T. Land of risk/land of opportunity: Cumulative environmental vulnerability in California’s San Joaquin valley. Davis, CA: UC Davis Center for Regional Change 2011.
- EPA US. Framework for Cumulative Risk Assessment. US Environmental Protection Agency, Office of Research and Development, National Center for Environmental Assessment, Washington Office 2003:EPA/600/p-02/001F.
- Ramirez SM, Villarejo D. Poverty, housing, and the rural slum: policies and the production of inequities, past and present. American journal of public health 2012;102:1664-75.
- Capitman JB, Marlene. Operational and Statutory Capacity of Local Health Departments in the San Joaquin Valley. California State University, Fresno: Central Valley Health Policy Institute 2013.
- Preventable Hospitalizations in California: Statewide and County Trends in Access to and Quality of Outpatient Care, Measured with Prevention Quality Indicators (PQIs) 1999-2008: California Office of Statewide Health Planning and Development; 2010.
- Van Lerberghe W. The world health report 2008: primary health care: now more than ever: World Health Organization; 2008.
- Grijalva CG, Nuorti JP, Arbogast PG, Martin SW, Edwards KM, Griffin MR. Decline in pneumonia admissions after routine childhood immunisation with pneumococcal conjugate vaccine in the USA: a time-series analysis. The Lancet;369:1179-86.
- Sarwer DB, Allison KC, Gibbons LM, Markowitz JT, Nelson DB. Pregnancy and obesity: a review and agenda for future research. J Womens Health (Larchmt) 2006;15:720-33.
- Alexeeff G, Assessment H, Sacramento C. ANALYSIS OF CALENVIROSCREEN 1.1 SCORES AND RACE/ETHNICITY. 2014.
- Derose KP. Do bonding, bridging, and linking social capital affect preventable hospitalizations? Health services research 2008;43:1520-41.
- California Health Interview Survey. In: UCLA, ed. Los Angeles, CA: Center for Health Policy Research; 2012.
Appendix A
Excerpt from Poverty and Pollution: Preventable Childhood Morbidity in Central California (Methods):
This is a retrospective analysis of inpatient hospitalizations. Inpatient healthcare facilities licensed by the state of California are required to submit data to the California Office of Statewide Planning and Development (OSHPD) semi-annually regarding all patient hospitalizations.26 The data are de-identified and made publically available within 2 years of admission. Each hospitalization record includes information on the patient’s race/ethnicity, age, sex, county and zip code of residence, expected source of payment, hospital charges, and facility type. There may be repeat hospitalizations for the same individual but unfortunately the de-identification process did not allow for hospitalizations to be grouped by patient. A primary ICD-9 diagnosis and up to 24 additional diagnoses are also included. For this analysis, OSHPD Patient Discharge Data (PDD) in 2012 were utilized from admissions of individuals residing within the eight San Joaquin Valley counties: San Joaquin; Stanislaus; Merced; Madera; Fresno; Kings; Tulare and Kern.
Measures
Preventable Hospitalizations: Potentially avoidable hospitalizations in the San Joaquin Valley were assessed using ICD-9 codes classified as Prevention Quality Indicators (PQIs) by the Agency for Healthcare Research and Quality (AHRQ). The AHRQ PQIs consist of ambulatory care-sensitive conditions for which appropriate outpatient cares can prevent the need for hospitalization or for which early intervention can prevent complications or more severe disease. These measures were then adapted for use in a pediatric population in a study evaluating hospital charges for preventable pediatric hospitalizations.7 The ICD-9 designations outlined in Lu, et al. (2012) were used to classify preventable pediatric hospitalizations for this study. For the analysis, hospitalizations were aggregated at the zip code level by disease.
Pollution Burden: The California Environmental Protection Agency identified and grouped key indicators to produce the CalEnviroScreen (CES) score. Pollution burden and deprivation (population characteristics) are the two indices that create the CES in the CalEnvironScreen 1.0 report. Initially, a model with the CES total score (pollution burden and deprivation) as the predictor was compared to a model with the pollution burden score and other demographic predictors, serving as proxy measures for the deprivation score. The comparison showed that more variance in preventable pediatric hospital admission was accounted for with the proxy model; therefore, only the pollution burden score from the CES was used in subsequent analysis. The proxy measures provide the advantage of identifying unique pathways that stem from neighborhood context contributing to pediatric admissions.
The pollution burden score was calculated using estimates for 11 such indicators, including: ozone concentrations; PM2.5 concentrations; diesel emissions; pesticide use; toxic releases from facilities; traffic density; cleanup sites; groundwater threats; hazardous waste; impaired water bodies; and solid waste sites and facilities.27 Cronbach’s alpha yielded a score of .74, suggesting a fair degree of internal consistency. This variable is continuous in the analysis.
Additional covariates: Additional measures for age distribution and poverty rates were estimated from 2010 US Census Data. Count estimates were obtained from the US Census to control for the population at risk within each zip code. This method adjusts the scale of the model and allows for coefficients to be interpreted as rate ratios. Areas of low poverty were identified by examining the distribution of individuals living below 100% of the Federal Poverty Line (FPL) throughout California. Forty percent of zip codes in California are composed of less than 14% of individuals living below poverty. This standard was used to identify areas of low poverty within the SJV. In the SJV, 20% of zip codes are composed of less than 14% of residents living below poverty. Poverty is a dichotomous measure in the analysis indicating that either a zip code has more or less than 14% of residents living below FPL. Age distribution is a continuous measure, indicating the proportion of residents under the age of 15.
An index of relative diversity, a continuous measure which indicates how likely an individual is to encountering someone of a different race from themselves in their community, was computed.28 Estimates from the 2010 Census were used to identify subgroups (Hispanic, white, African-American, Asian, Native Hawaiian, American Indian, and other). See Table 3 for the computational formula.
Data Analysis
In order to accommodate the discrete nature of the dependent variable, a Poisson-based negative binomial model was used. White’s test of heteroskedasticity demonstrated that an ordinary least squares model was a poor fit for these data (p-value= < .001) due to a violation of the assumption of homogeneity of error variance. A Poisson model was then tested. Although the Poisson model was more appropriate than ordinary least squares (OLS), a significant amount of over-dispersion was unaccounted for by fixed Poisson parameters. The negative binomial model was a significantly better fit (log likelihood ratio p-value=< .05) than the basic Poisson.
The final model was used to analyze the effect of neighborhood-level factors on pediatric preventable hospitalizations. Tests for interaction were conducted, both visually with graphs and models with interaction terms, and no interaction relationships were significant, independently or in the overall model. The sample was divided into age categories (under 1, 1-5, 5-14) and race categories (white/non-Hispanic, Hispanic/ Other and African American) to understand the individual level boundary conditions of the final ecological model. Individuals who identified as Hispanic or “other” were grouped together as the rates of hospitalizations were similar in these populations, as well as other demographic factors including poverty rates and insurance coverage.29 Preliminary analysis demonstrated that events are too rare when investigating the additional stratification by both age and race categories (i.e. under 1 and white/non-Hispanic).