Longevity for San Joaquin Valley Elders: Individual and Neighborhood Factors



Individual and Neighborhood Characteristics

Central California Center for Health and Human Services
1625 East Shaw Avenue, Suite 146
Fresno, CA 93710-8106
Phone: 559.228.2150 Fax: 559.228.2168
www.cvhpi.org


Abstract
This report examines the determinants of longevity for San Joaquin Valley (SJV) persons aged 65 and older in relation to individual, health care, and neighborhood factors. Although examining patterns of survival and death for elders does not provide a complete picture of the overall health of older adults in the region, understanding longevity determinants can help identify priorities for public health. Findings indicate that San Joaquin Valley residents are more likely to die before age 65 and lose more years of life after age 65 than do other Californians. There were notable gender and race/ethnicity differences, with women and whites experiencing greater longevity than do men, Latinos, and African Americans. Elders in the San Joaquin Valley have higher use of avoidable hospitalizations and lower use of planned elective surgeries than their peers in the rest of California. Even after accounting for individual differences, elder San Joaquin Valley residents who lived in more walkable neighborhoods with more frequent planned surgeries had more years of life after 65, while those who lived in neighborhoods with increased higher poverty rates and higher rates of unplanned ER visits lost more years after age 65.
Introduction
The United States and other industrialized counties have experienced notable improvements in the length of life, and about 81% of US residents are expected to live past age 65.1 Public health initiatives, such as improvements in sanitation, control of infectious disease and improved nutrition have been key factors. Since the 1930’s improvements in life expectancy are more often attributed to access to health care2,3 and modifying lifestyle behaviors (such as substance use, physical inactivity, and obesity).4 Despite overall increases in the length and quality of life for older people, broad differences across gender5,6, racial/ethnic7, social class8, neighborhood design9and rural-urban residence have been found.10 Findings on the influence of diverse potentially modifiable factors on elder health outcomes indicate the potential for continued improvements. As a result, a major goal for public health policy in the USA is to broaden improvements in elder health by addressing individual behavioral, social and physical environment, and health-services related determinants.11 This report examines the determinants of longevity for San Joaquin Valley (SJV) persons aged 65 and older in relation to individual, health care, and neighborhood factors. Although examining patterns of survival and death for elders does not provide a complete picture of the overall health of older adults in the region, understanding longevity determinants can help identify priorities for public health strategies and other policy areas.

Older Adult Longevity: Multiple Determinants
The number of years a person is likely to live (life expectancy) has been examined from multiple perspectives. Although there is consensus that genetic factors are determinants of longevity, specific pathways have not been identified12,13. Further, there is increasing evidence for epigenetic (interactions of genes with environment or behavior factors) determination of longevity and thus the continuing attention to other potential causes.14 Four groups of determinants have been highlighted in prior studies: individual demographics; health related behaviors; health services use and neighborhood environment.
Individual Demographics
For older adults in this country, individual factors such as gender, race/ethnicity, education and wealth have been linked to longevity, functional status, and quality of life. Populations with greater economic security live longer and report greater health and well-being including Asian Americans, older whites, women and those with more education.15 There has been evidence for a Latino paradox in deaths before age 65, with Latinos experiencing generally better health outcomes than other groups despite lower average socio-economic status. However, among elders, Mexican Americans and other Latinos appear at greater risk of premature death.16 There are substantial differences in life-expectancy associated with these factors, for example, in 2012 additional years of life expectancy at age 65 was 17.9 and 20.5 for males and females, respectively17 and for men, there was a 3 year advantage for white men compared to African American men. Notably, consideration of other factors, such as individual health behaviors or health care use, tends to reinforce the influence of demographic differences. For elders, demographic categories serve as proxy measures of a life-time of differential exposure to living condition, health events and interventions, social supports, and other sources of stress and resilience, all closely associated with different demographic positions in the society.18 The apparent impacts of cumulative exposures and behaviors before age 65 has prompted elder health promotion and disease prevention experts to focus renewed attention on promoting lifestyle modifications and use of clinical preventive services beginning in early adulthood (1).
Health Related Behaviors
Current and lifetime health risk behaviors, such as smoking, diet, exercise, substance use, and social support have been consistently linked to health outcomes.19 The influence of these factors appears smaller for elders than for younger persons, perhaps reflecting the selective survival into old age of only the most resilient individuals20. These health risk behaviors are increasingly recognized as at least partially a response to stress because they are closely correlated with individual factors such as gender, race/ethnicity and income, as well as neighborhood factors such as sprawl, pollution, and segregation. Health risk behaviors can change even in old age, and there is convincing evidence that smoking cessation, weight management and physical activity interventions can improve health and survival21,22 As a result, increasing access to and participation of adults age 50 and above in evidence-based programming to improve physical activity, social engagement and other factors are key Healthy People 2020 objectives.

Health Services Use
For older adults, the accessibility and quality of medical care has been associated with longevity and quality of life. Older adults who receive higher frequency and quality of primary medical care experience lower mortality23,24 Further, older persons with greater access to primary care are less likely to have avoidable hospitalizations.25,26 There is extensive literature on the positive impacts of clinical preventive services (such as cancer screening and immunizations) as well as several high technology surgical and medical interventions for older people, such as angioplasty and open heart surgeries for heart disease, surgical treatment of colorectal, breast and other cancer, and surgical care. Having these tests and treatments s on a timely, planned basis is often associated with lower mortality and better outcomes.27,28,29 Nonetheless, there is evidence that market area variations in surgical rates, especially for elective procedures may be more indicative of style of medical practice, patient-doctor relationships, and health system organization than with underlying need30,31,32
Neighborhood Environments
Because individual demographic and health risk behaviors in elders reflect both cumulative life experiences and current exposures, they have been found to be the most powerful predictors of longevity among elders. Researchers, nonetheless, have consistently found impacts of multiple neighborhood features on longevity. Neighborhood socio-economic status has been found to be an independent predictor of heart disease mortality33 and all-cause mortality34.
| County | Examples of Current Initiatives |
|---|---|
| Kings |
|
| Fresno |
|
| Madera |
|
| Merced |
|
| San Joaquin |
|
| Stanislaus |
|
| Tulare |
|
Methods
This report utilizes data from a variety of statewide governmental agencies. Death Statistical Master Files for the years 2009-2013 were obtained from the California Department of Public Health (CDPH). Emergency department (ED) visits and patient discharge data (hospitalizations) were gathered from the Office of Statewide Health Planning and Development (OSHPD), 2009-2011. The Walk Score® generated by walkscore.com was used to analyze walkability (see Appendix A). Approval from the California Department of Public Health Vital Statistics Advisory Committee (VSAC) and the California Health and Human Services Agency’s Committee for the Protection of Human Subjects (CPHS) was obtained. All data files mentioned above provided information on place of residence (county and zip code), age, gender, and other non-identifiable demographics. All rates and population estimates were based on 2010 Census files. Self-reported data is reported from UCLA’s California Health Interview Survey (CHIS).
Indicators
In an attempt to describe premature mortality in the SJV we developed several indicators of age of death. We use age at death to illustrate the distribution of premature death by race/ethnicity (Figure 1). We used years of life lost as a measure of premature mortality from gender-specific life expectancy for eight five-year categories starting at age 65. This method allows for the adjustment of gender and age differences in life expectancy. In order to address morbidity, several indicators were developed including hospitalization and emergency department rates for ambulatory care-sensitive conditions (ACSC) and scheduled elective procedures. ACSCs include upper respiratory infection, asthma acute exacerbation, febrile convulsions, dehydration, and pneumonia. For a complete list of ACSCs please see the Agency for Healthcare Research and Quality’s Prevention Quality Indicators. Scheduled elective procedures reflect hospital events in which an arrangement was made at least 24 hours prior to admission and includes colectomy, gallbladder removal, coronary artery bypass graft, endarterectomy, and heart valve replacement. For a complete list of procedures included see OSHPD common surgery.
Analysis
This report describes mortality and factors that influence longevity within the SJV, and whenever possible, compares the health status of the SJV to California as whole. First, we investigate premature mortality of all ages within the SJV by race/ethnicity and compare these rates to the state. Second, the geographic distribution of years of life lost is examined in adults aged 65 and older. The remainder of this report focuses exclusively on this older adult population. Third, rates of ED Ambulatory Care-Sensitive Conditions (ACSC) and scheduled elective procedures are examined within the SJV in order to understand where potentially avoidable healthcare utilization can be decreased and increased, respectively. Fourth, rates of modifiable health indicators are examined by region to determine how the SJV compares to the state. Finally, potentially modifiable social determinants of health are examined to determine the extent to which neighborhood characteristics are associated with longevity.
Findings
Figure 1. Cumulative Percentage of Age of Death by Race/Ethnicity in the SJV, 2009-2013
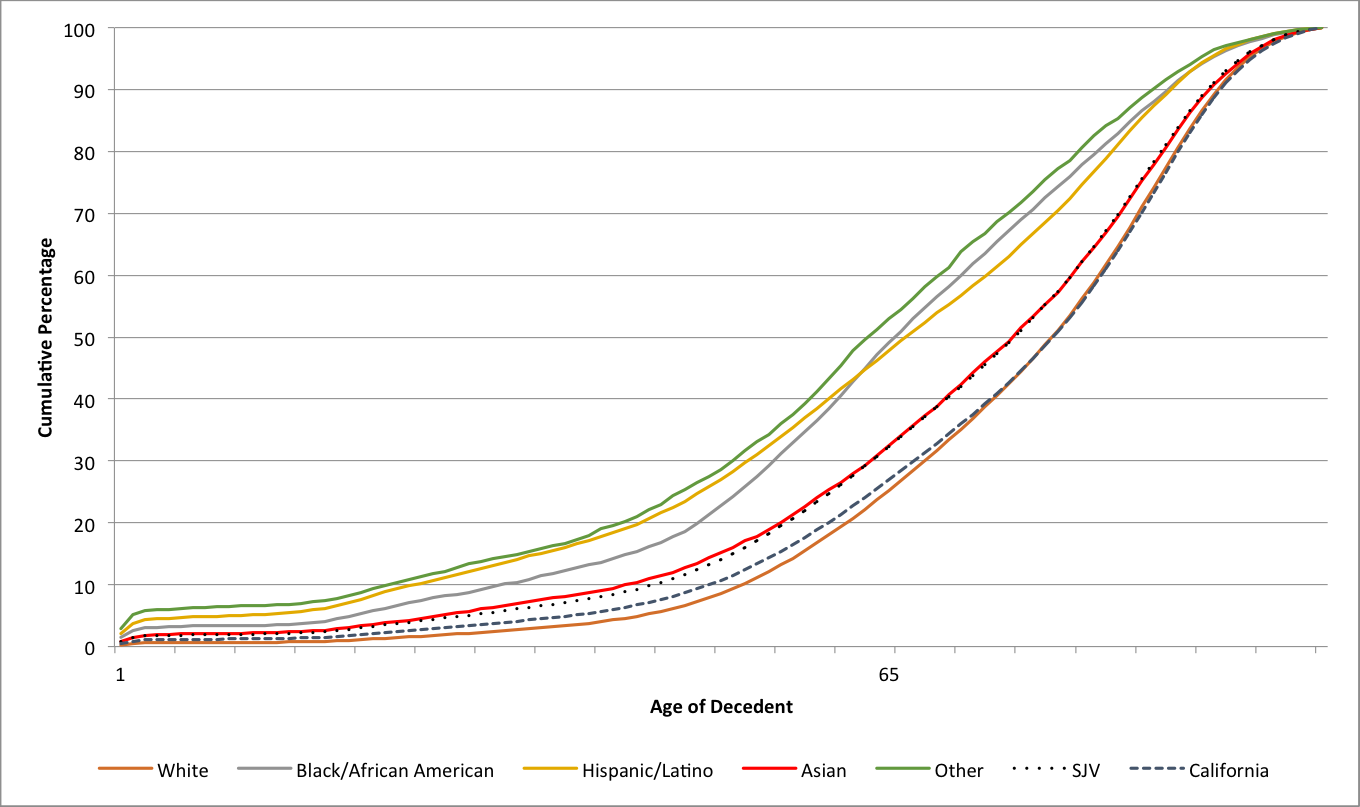
Figure 1 illustrates the cumulative percentage of death by age and race/ethnicity between the years 2009 and 2013. This figure illustrates that individuals living in the SJV suffer from premature death at a greater proportion than those living in other regions of the state. Within every age group, the SJV has a greater proportion of accumulated deaths compared to the rest of California, as evidenced by the higher SJV broken-line in Figure 1. The race subgroups represent deaths only in the SJV. Most notably, 40% of all deaths in African Americans, Latinos, and “other” race categories occur to individuals younger than 60 years of age. In contrast, less than 20% of white deaths are of individuals less than 60 years of age. These regional and racial/ethnic differences in premature mortality shape the context for examining longevity in the SJV and highlight the need to focus on the determinants of premature mortality in the region.

Figure 2. Years of Life Lost Age 65 and Older by Zip Code in the SJV, 2009-2013
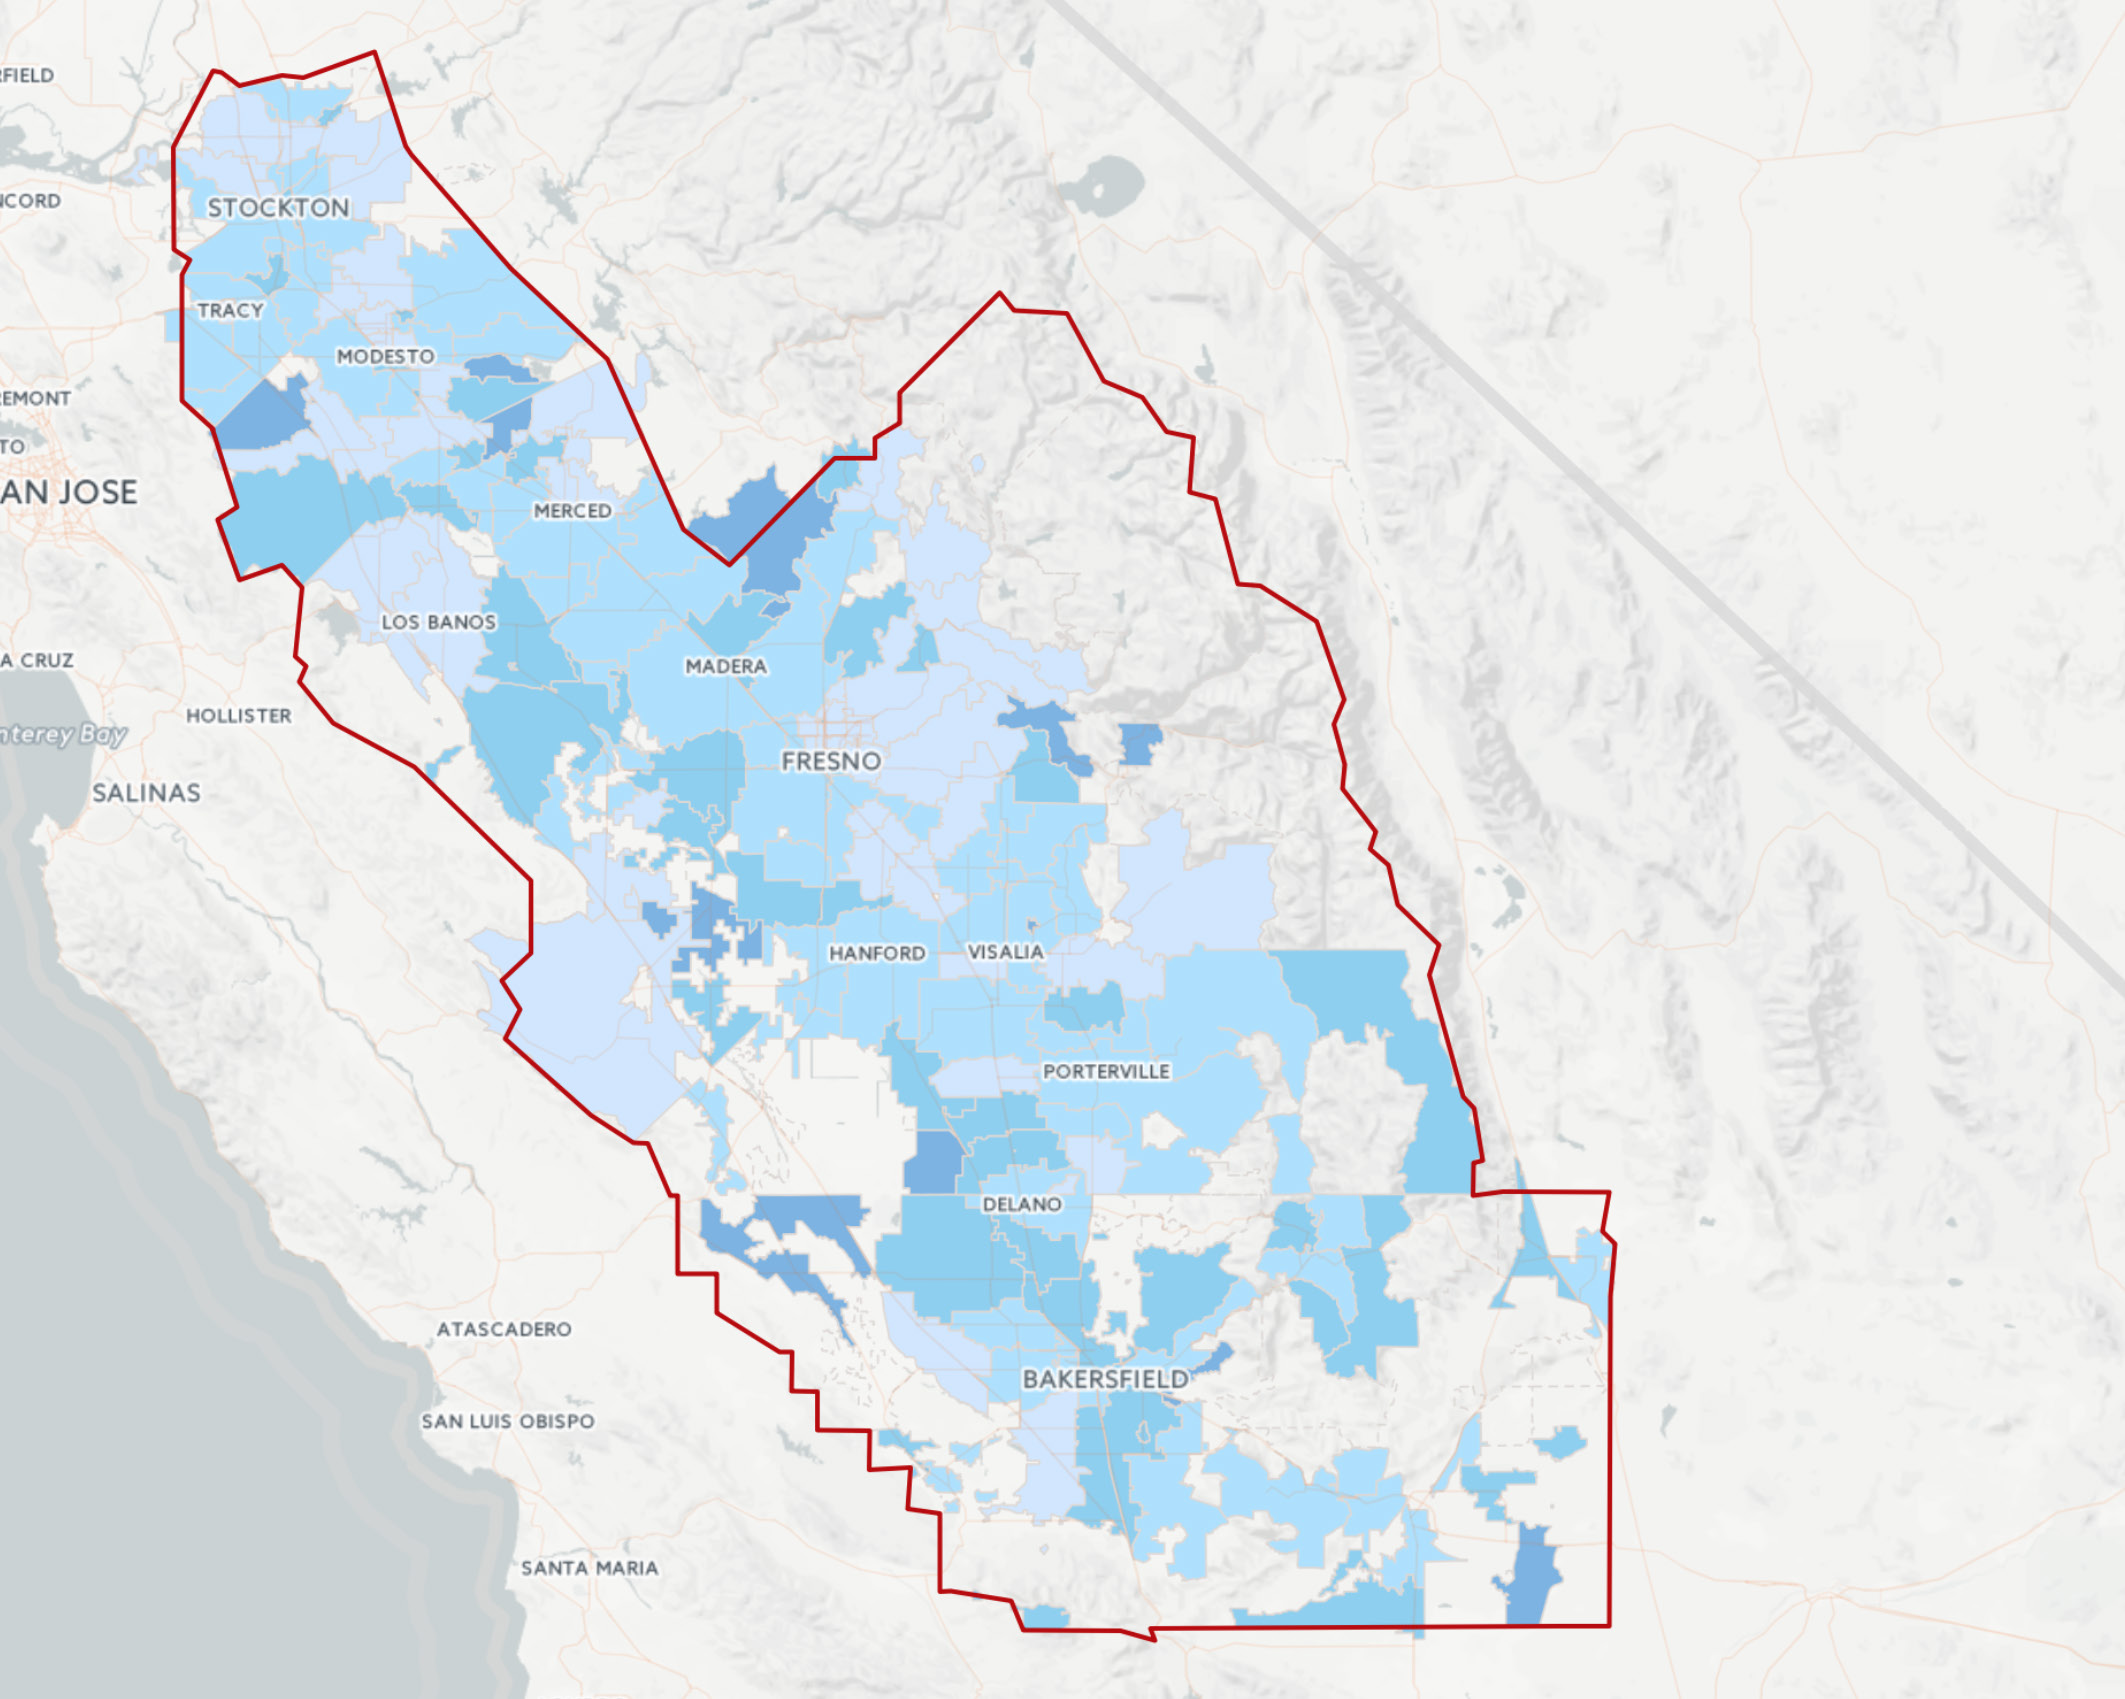
Figure 2 displays the geographic distribution of years of life lost (YLL) in the SJV for individuals deceased at age 65 or older. In this map, YLL was computed as the difference between the age of an individual at death and the life expectancy of the individual’s zip code. The SJV’s average YLL is 8.5, which is greater than the rest of California at 6.3. In Figure 2, the darkest shade represents areas where older adults lose more than nine years of life (one standard deviation above the state’s average). These rural communities tend to have the largest rates of poverty and are generally not walkable due to lack of sidewalks and local amenities. The three leading causes of death in the SJV are: disease of the circulatory system; neoplasms; and disease of the respiratory system. With regard to these three leading causes of death, older adults in the SJV are at similar risk as older adults living in other regions of California. However, there are several different measures for comparing premature mortality across regions including life expectancy, average age of death, and years of life lost. A table is included in Appendix B which illustrates that inequities exist by geographic region, gender, and race/ethnicity across several measures of premature mortality. For further details on rates of mortality in older adults see Appendix B.

It is well documented that men are at higher risk for mortality than women, and that age is positively correlated with mortality. In light of this, we have adjusted YLL by the life expectancies of each gender and eight five-year age categories beginning at age 65. Potentially, gender and age are major risk factors that are non-modifiable through health interventions.
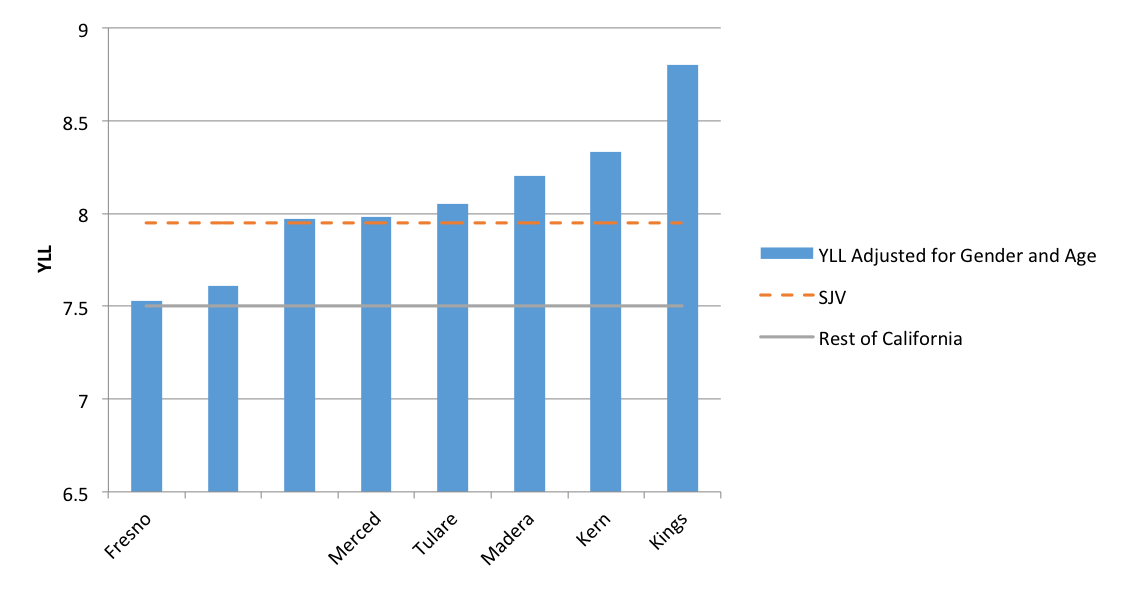
Figure 3. Years of Life Lost Age 65 and Older Adjusted for Gender and Age by County in the SJV, 2009-2013
After statistically adjusting for gender and age, the regional difference between the SJV and the rest of California in YLL is largely reduced. Figure 3 highlights the regional and county differences that remain after such adjustment. Unfortunately, each individual county, and the SJV region as a whole, have greater YLL than the rest of California. These differences in YLL are, are at the very least, attributable to factors beyond the influence of an individual’s gender and age.
Figure 4. Rates of ACSC ED Visits and Scheduled Elective Procedures by County in the SJV, 2009-2011
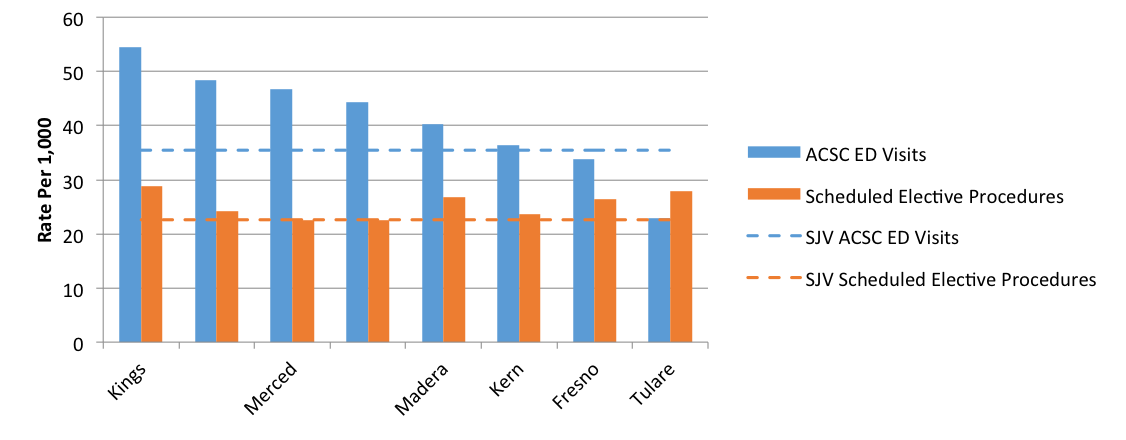
Note. Ambulatory care-sensitive conditions (ACSC) are defined by the Agency for Healthcare Research and Quality’s (AHRQ) Prevention Quality Indicators (PQI). Mean length of life is computed from 2009-2010 death statistical master files for those who lived passed 65 years of age. Rate is computed per 1,000 in the population.
Figure 4 illustrates the rate of ED visits for ACSCs and scheduled elective procedures in individuals age 65 and older. We could not compute statewide rates directly from the existing data set for ACSC ED visits or scheduled elective procedures to use as a comparison. However, according to the Healthcare Cost and Utilization Project (HCUP) produced by the Agency for Healthcare Research and Quality (AHRQ), the National rate of ACSC ED visits in older adults is 48 per 1,000 indicating that nearly all counties in the SJV have a lower rate of ACSC ED utilization than the Nation. This suggests that a preventive infrastructure in the SJV is positively impacting the health and quality of life in older adults regarding these potentially avoidable conditions. Using the HCUP resources we were able to compute the state rate of scheduled elective procedures, 36.1 per 1,000. In Figure 4, the eight SJV counties have a lower rate of scheduled elective procedures than the state.
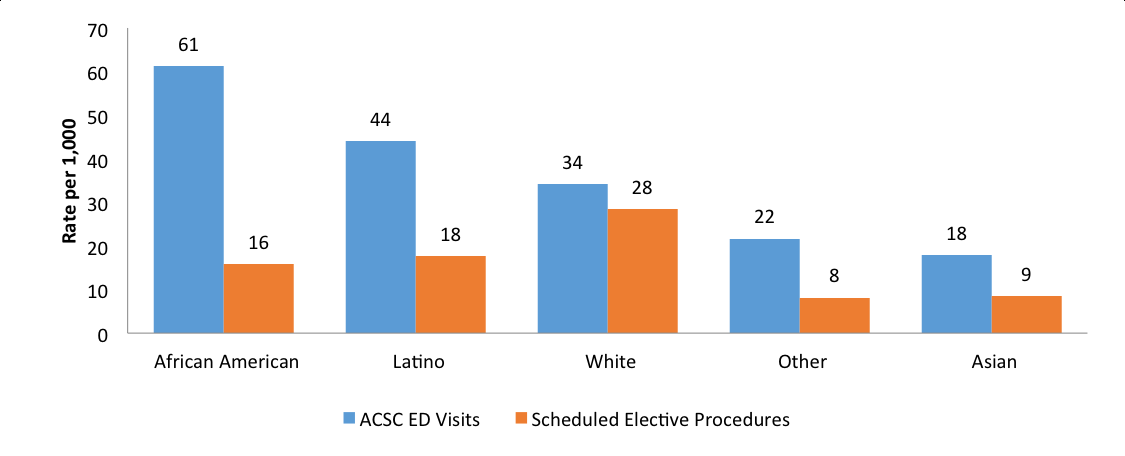
Figure 5. Rate of ACSC ED Visits and Scheduled Elective Procedures by Race/Ethnicity, 2009-2011, SJV
| Race/Ethnicity | ACSC ED Visits | Scheduled Elective Procedures |
|---|---|---|
| African American | 61 | 16 |
| Latino | 44 | 18 |
| White | 34 | 28 |
| Other | 22 | 8 |
| Asian | 18 | 9 |
Ambulatory care-sensitive conditions (ACSC) are defined by the Agency for Healthcare Research and Quality’s (AHRQ) Prevention Quality Indicators (PQI). Mean length of life is computed from 2009-2010 death statistical master files for those who lived passed 65 years of age. Rate is computed per 1,000 in the population.
Figure 5 displays rates of ACSC ED visits and scheduled elective procedures by race/ethnicity within the SJV. Although the SJV as a whole has a lower rate of ACSC ED visits than the Nation, as shown in Figure 4, disparities within the region exist among racial/ethnic subgroups. African Americans and Latinos have the highest rates of potentially avoidable utilization, with at least double the utilization rate than Asians and Others. Whites have the highest rate (28 per 1,000) of scheduled elective procedures in the SJV with a 55% increased rate compared to Latinos (18 per 1,000) who have the second highest utilization.
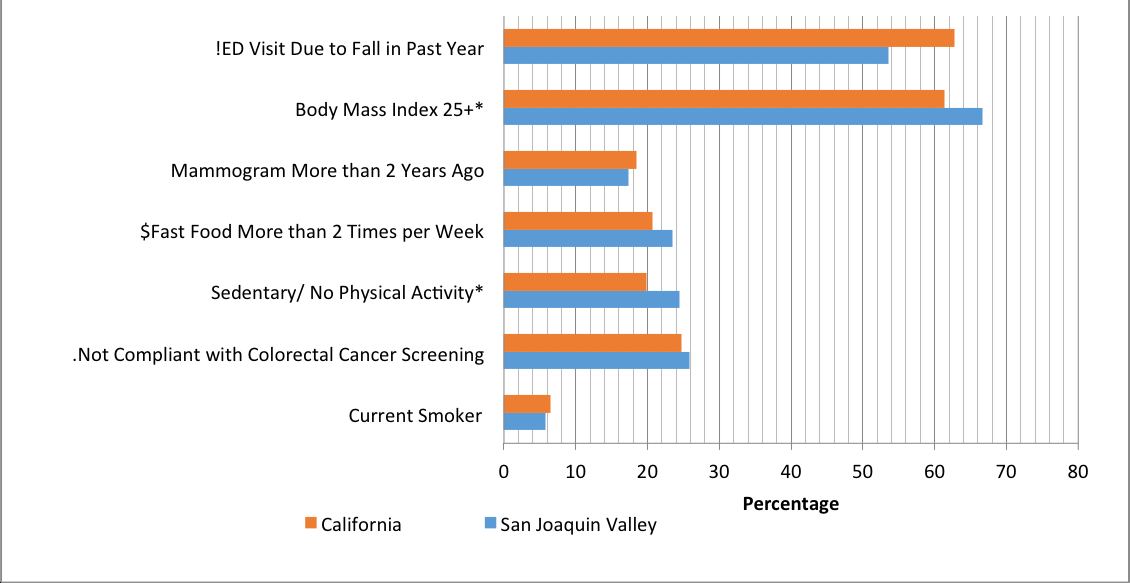
Figure 6. Self-Reported Health Indicators Older Adults, 2009 - 2012, SJV
*p < .05.
1UCLA AskCHIS database.
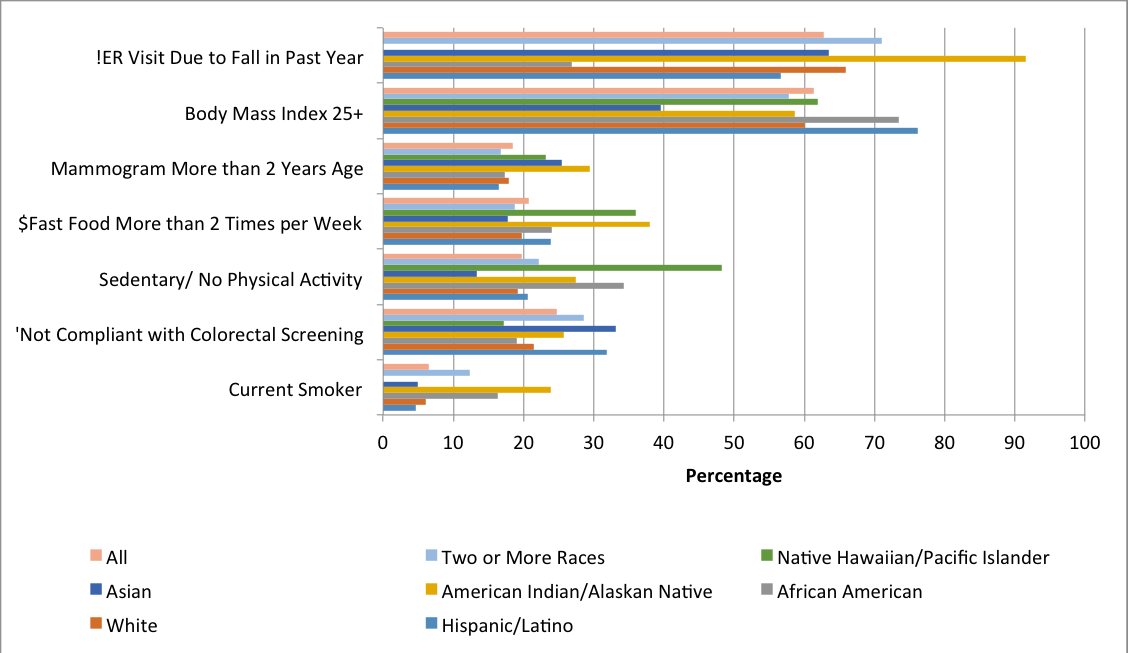
Figure 6 compares the SJV to the state on seven modifiable health indicators. The SJV is very similar to California on self-reported rates of ED visits due to falls, mammogram and colorectal screenings, fast food consumption, and smoking status. The two modifiable health indicators where we do see a regional difference include: body mass index and physical activity. Despite these two indicators, which are closely related, Figure 6 suggests that older adults living in the SJV report comparable health outcomes to the rest of California. When investigating these seven modifiable health indicators within the SJV by race/ethnicity, we were unable to produce stable estimates due to the small sample sizes. Please see Appendix C for an in-depth illustration of the racial/ethnic disparities observed across California amongst these seven health indicators.
Social Determinants of Health
In order to better understand social determinants of YLL, a multivariate (hierarchical linear model) analysis examined individual and neighborhood level factors. Four zip code-level measures were examined in this analysis including: walkability; poverty; rate of ACSC ED utilization; and rate of scheduled elective procedures. Individual-level measures included gender, race/ethnicity, education, and marital status. For greater details on methods and results please see Appendix D Table D1.
The analysis suggests that neighborhood walkability, poverty, rate of ACSC ED utilization, and the rate of scheduled elective procedures are significantly and independently associated with YLL beyond individual demographics. Poverty and the rate of ACSC ED visits are both associated with higher levels of YLL compared to areas of affluence and low ACSC ED rates, respectively. The walkability of a neighborhood and the rate of scheduled elective procedures proved to be protective factors associated with YLL. In other words, individuals living in neighborhoods with sidewalks, parks, and other amenities tend to live longer than those who do not, and a similar—positive relationship is observed in communities with increased rates of schedules elective procedures. Alone, the Walk Score® had the strongest association with YLL compared to the other three factors investigated in this analysis. It can be concluded that all four zip code-level factors previously mentioned are associated with YLL beyond the individual-level effects of gender, age, race/ethnicity, and education. See Appendix D Figure D1 and D2 for greater discussion of other social determinants of health that are geographically distributed throughout the SJV similarly to poverty and Walk Score®.

Discussion and Recommendations
Overall, this study found that Valley residents are more likely to die before age 65 and loose more years of life after age 65 than do other Californians. There were notable gender and race/ethnicity differences, with women and whites experiencing greater longevity that do men, Latinos, and African Americans. At the same time, the findings indicate that elders in the San Joaquin Valley have higher use of avoidable (ambulatory care sensitive) hospitalizations and lower use of planned elective surgeries than their peers in the rest of California. There were also racial/ethnic differences in access to care: whites had a higher use of planned elective surgeries and fewer avoidable hospitalizations than Latinos and other persons of color. Latino elders had notably lower rates of planned elective treatments. Perhaps most noteworthy was that even after accounting for individual differences in race/ethnicity, gender, and education, that elder San Joaquin Valley residents who lived in more walkable neighborhoods with more frequent planned surgeries had more years of life after 65, while those who lived in neighborhoods with increased higher poverty rates and higher rates of unplanned ER visits lost more years after age 65. Although findings from the California Health Interview Survey indicate a number of racial/ethnic group differences in elder health behaviors, they do not suggest that individual high risk health behaviors are higher than in the Valley. Together, these findings suggest that improving elder outcomes requires attention to both increasing appropriate use of health care services, most notably for Latinos, and greater attention to building communities that promote healthy life styles and a culture of prevention and wellness.
Although the local public health departments that make-up the San Joaquin Public Health Consortium do not receive specific funding for eldercare preventive and care management programming, many have sought to engage elders in chronic disease self-management, health care and medications access initiatives, nutrition, and other preventive care initiatives. They have also sought elder involvement in a range of initiatives that address the social determinants of health by improving neighborhood conditions and strengthening networks of support for treatment and disease management. While this two-pronged approach seems responsive to the data, the notable variability across racial/ethnic groups and neighborhoods in elder outcomes, also suggests the need for more concentrated attention to elders’ engagement in health care and prevention in the least well-served neighborhoods, using culturally tailored strategies for engaging elders in prevention and treatment.
APPENDIX A
Walk Score Categories
| Score | Category | Description |
|---|---|---|
| 90 to 100 | Walker’s Paradise | Daily errands do not require a care |
| 70 to 89 | Very Walkable | Most errands can be accomplished on foot |
| 50 to 69 | Somewhat Walkable | Some errands can be accomplished on foot |
| 25 to 49 | Car-Dependent | Most errands require a car |
| 0 to 24 | Car-Dependent | Almost all errands require a car |
This scoring scale was created by walkscore.com and is used to facilitate interpretation of walk scores.
APPENDIX B
| Major Diagnostic Category2 | San Joaquin Valley | Rest of California | |||||
|---|---|---|---|---|---|---|---|
| White | Black/African American | Hispanic/Latino | Asian | Other | SJV | ||
| Disease of the circulatory system | 2005.4 | 1832.2 | 1132.7 | 1211.6 | 308.7 | 1621.3 | 1546.8 |
| Neoplasms | 1067.6 | 1073.3 | 629.5 | 611.7 | 173.4 | 870.8 | 978.9 |
| Disease of the respiratory system | 667.4 | 428.3 | 300.2 | 339.9 | 107.3 | 511.5 | 468.9 |
| Disease of nervous system | 452.8 | 313.2 | 183.3 | 163.8 | 48.9 | 336.9 | 358.8 |
| Endocrine, metabolic, and nutritional disorders | 194.6 | 318.5 | 235.2 | 204.3 | 54.6 | 198.6 | 168.2 |
| Mental and behavioral | 174.7 | 140.5 | 78.7 | 63.3 | 26.0 | 133.0 | 189.6 |
| Disease of the digestive system | 153.6 | 141.9 | 162.3 | 114.9 | 31.8 | 143.6 | 121.2 |
| External causes of mortality | 122.8 | 73.6 | 69.4 | 91.5 | 23.5 | 99.4 | 97.6 |
| Disease of genitourinary system | 102.5 | 144.5 | 91.6 | 83.3 | 22.9 | 94.4 | 86.4 |
| Infections and parasitic diseases | 97.9 | 127.1 | 90.4 | 107.3 | 21.6 | 92.3 | 63.0 |
| Muscoskeletal system and connective tissue | 24.6 | 13.4 | 17.9 | 15.1 | 4.4 | 20.6 | 20.8 |
| Symptoms and signs, mot elsewhere classified | 15.8 | 17.4 | 7.2 | 12.4 | 3.8 | 12.9 | 20.8 |
| Blood forming organs and immune disorders | 15.5 | 20.1 | 13.8 | 10.3 | 6.4 | 14.2 | 10.1 |
| Disease of the skin and subcutaneous | 7.4 | 12.0 | 6.8 | 6.9 | 1.3 | 7.0 | 4.1 |
| Congenital malformations | 2.6 | 4.0 | 2.5 | 2.1 | 0.0 | 2.4 | 2.9 |
| Diseases of eye and adnexa | 0.2 | 0.0 | 0.0 | 0.0 | 0.0 | 0.1 | 0.1 |
1 Rate per 100,000
2 ICD-10-CM Categories
| Measure | Female | Male | ||
|---|---|---|---|---|
| White | Mexican American | White | Mexican American | |
| Life Expectancy at Age 65 | ||||
| Nation-Widea | 20.3 | 22 | 17.6 | 19.4 |
| California | 21.9 | 22.2 | 20.7 | 21.1 |
| San Joaquin Valley | 20.9 | 21.8 | 18.6 | 20.6 |
| Mean (SD) Years | ||||
| Age at Death | 83.3 (8.7) | 80.9* (8.4) | 80.4 (8.6) | 79.1* (8.4) |
| Years of life lostb | -0.21 (5.0) | 1.01* (5.0) | -0.15 (4.5) | 0.53* (4.6) |
* p < .01.
a Hispanic estimate by the Centers for Disease Control and Prevention, 2010
b negative values exceed life expectancy
APPENDIX C
Self-Reported Health Indicators by Race/Ethnicity, 2009-2012, California
1 UCLA AskCHIS database.
APPENDIX D
Walk Score® was used to indicate the walkability of a zip code and data from the US Census was collected to estimate the proportion of individuals living below 125% of the Federal Poverty Level. Data from the Office of Statewide Health Planning and Development (OSHPD) were used to compute rates of Ambulatory Care-Sensitive Conditions (ACSC) in the emergency department (ED) and scheduled elective procedures from patient discharge data. All individual level demographics were collected from Death Statistical Master Files (2009-2010) from the California Department of Public Health. The outcome measured was YLL for any cause of mortality for age 65 and older. YLL was calculated by obtaining the estimated life expectancy for 8 five-year categories for each gender, starting at age 65 and ending at age 100 plus.
| Fixed Factor | Coefficient | Standard Error |
|---|---|---|
| Neighborhood | ||
| Walk Score | -0.021** | 0.004 |
| Poverty | 0.018** | 0.004 |
| Rate of Scheduled Elective Procedures | -0.009* | 0.003 |
| Rate of ACSC ED Visits | 0.007* | 0.002 |
| Individual | ||
| Male | -0.096* | 0.039 |
| Married | 2.007* | 0.050 |
| No High School Diploma | -1.039** | 0.055 |
| African American | 1.830** | 0.148 |
| Hispanic/Latino | 1.303** | 0.074 |
| Asian | 0.371** | 0.121 |
| Other Race | 2.002** | 0.145 |
| Random Factor | Standard Deviation | Variance Component2 |
|---|---|---|
| Intercept, u0 | 0.518 | 0.268** |
| level-1, r | 4.798 | 23.025 |
** p < .001. * p < .01.
1 Hierarchical Linear Modeling was used with individuals at level 1 and zip codes at
level 2.
2 Variability in years of life lost between zip codes.
In California, 23.39% of individuals in each zip code on average are living below 125% of the Federal Poverty Line. Figure D1 highlights the communities within the SJV which are above the state average, and one standard deviation above (with more than 35.4% living in poverty). As previously discussed, impoverished communities have a strong association with YLL. The table below Figure D1 lists neighborhood indicators that are significantly associated with poverty and years of life lost. Communities with high proportions of foreign-born immigrants and renters are positively associated with poverty and years of lfe lost; while communities with high proportions of high school graduates and income are negatively associated with poverty and years of life lost.
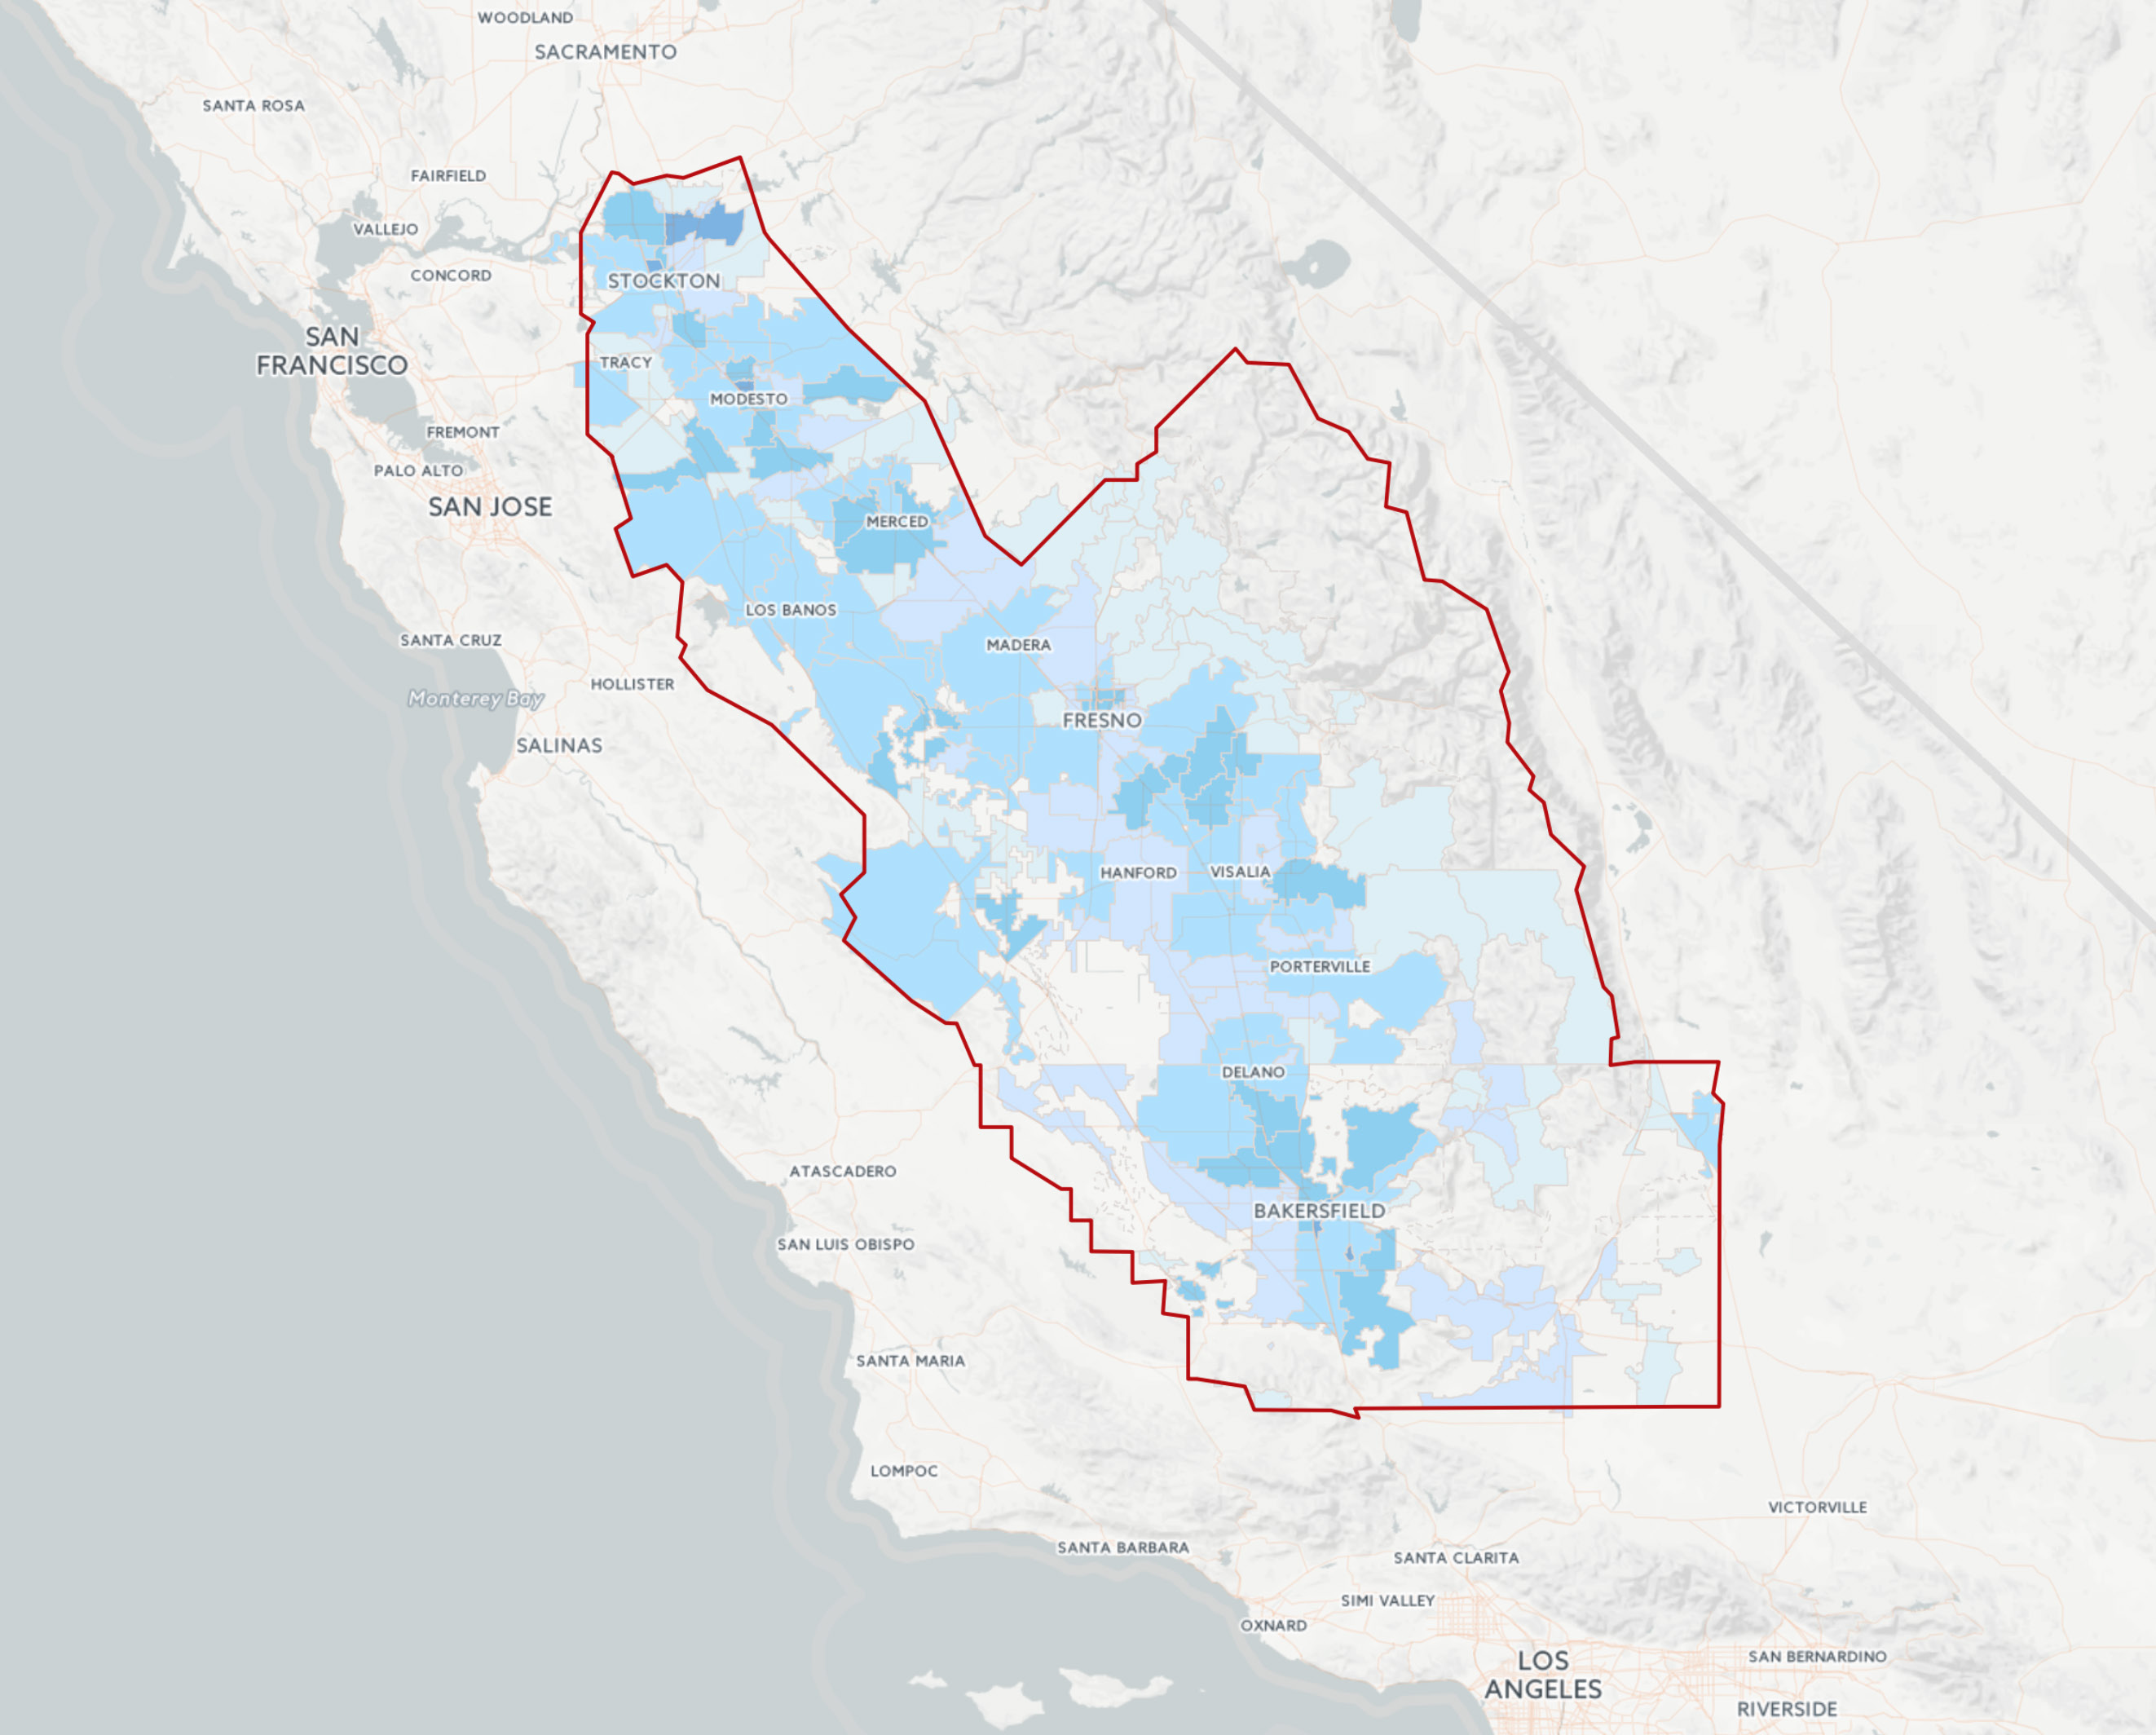
Figure D2 demontrates walkability throughout the SJV by zip code. According to Walk Score®, 98.5% of all zip codes in the SJV are car-dependent, the lowest two categories on the walk score scale (See Appendix A). Of these zip codes, 56.1% require a car for almost all errands and 42.4% require a car for most errands. Four zip codes, 1.5%, in the SJV have walk scores greater than 50, three of which are somewhat walkable and one is very walkable, and all are at the core centers of the largest cities in the region. Five indicators are shown below Figure D2 which are significantly correlated with both walkability and years of life lost. Population density is most highly correlated with walkability and is negatively associated with years of life lost. The proportion of renters in a community and racial diversity (Simpson index) were both positively associated with Walk Score®, although, they each had opposing associations with years of life lost.
Figure D1: Proportion Living Below 125% of the Federal Poverty Level by Zip Code, SJV, 2010
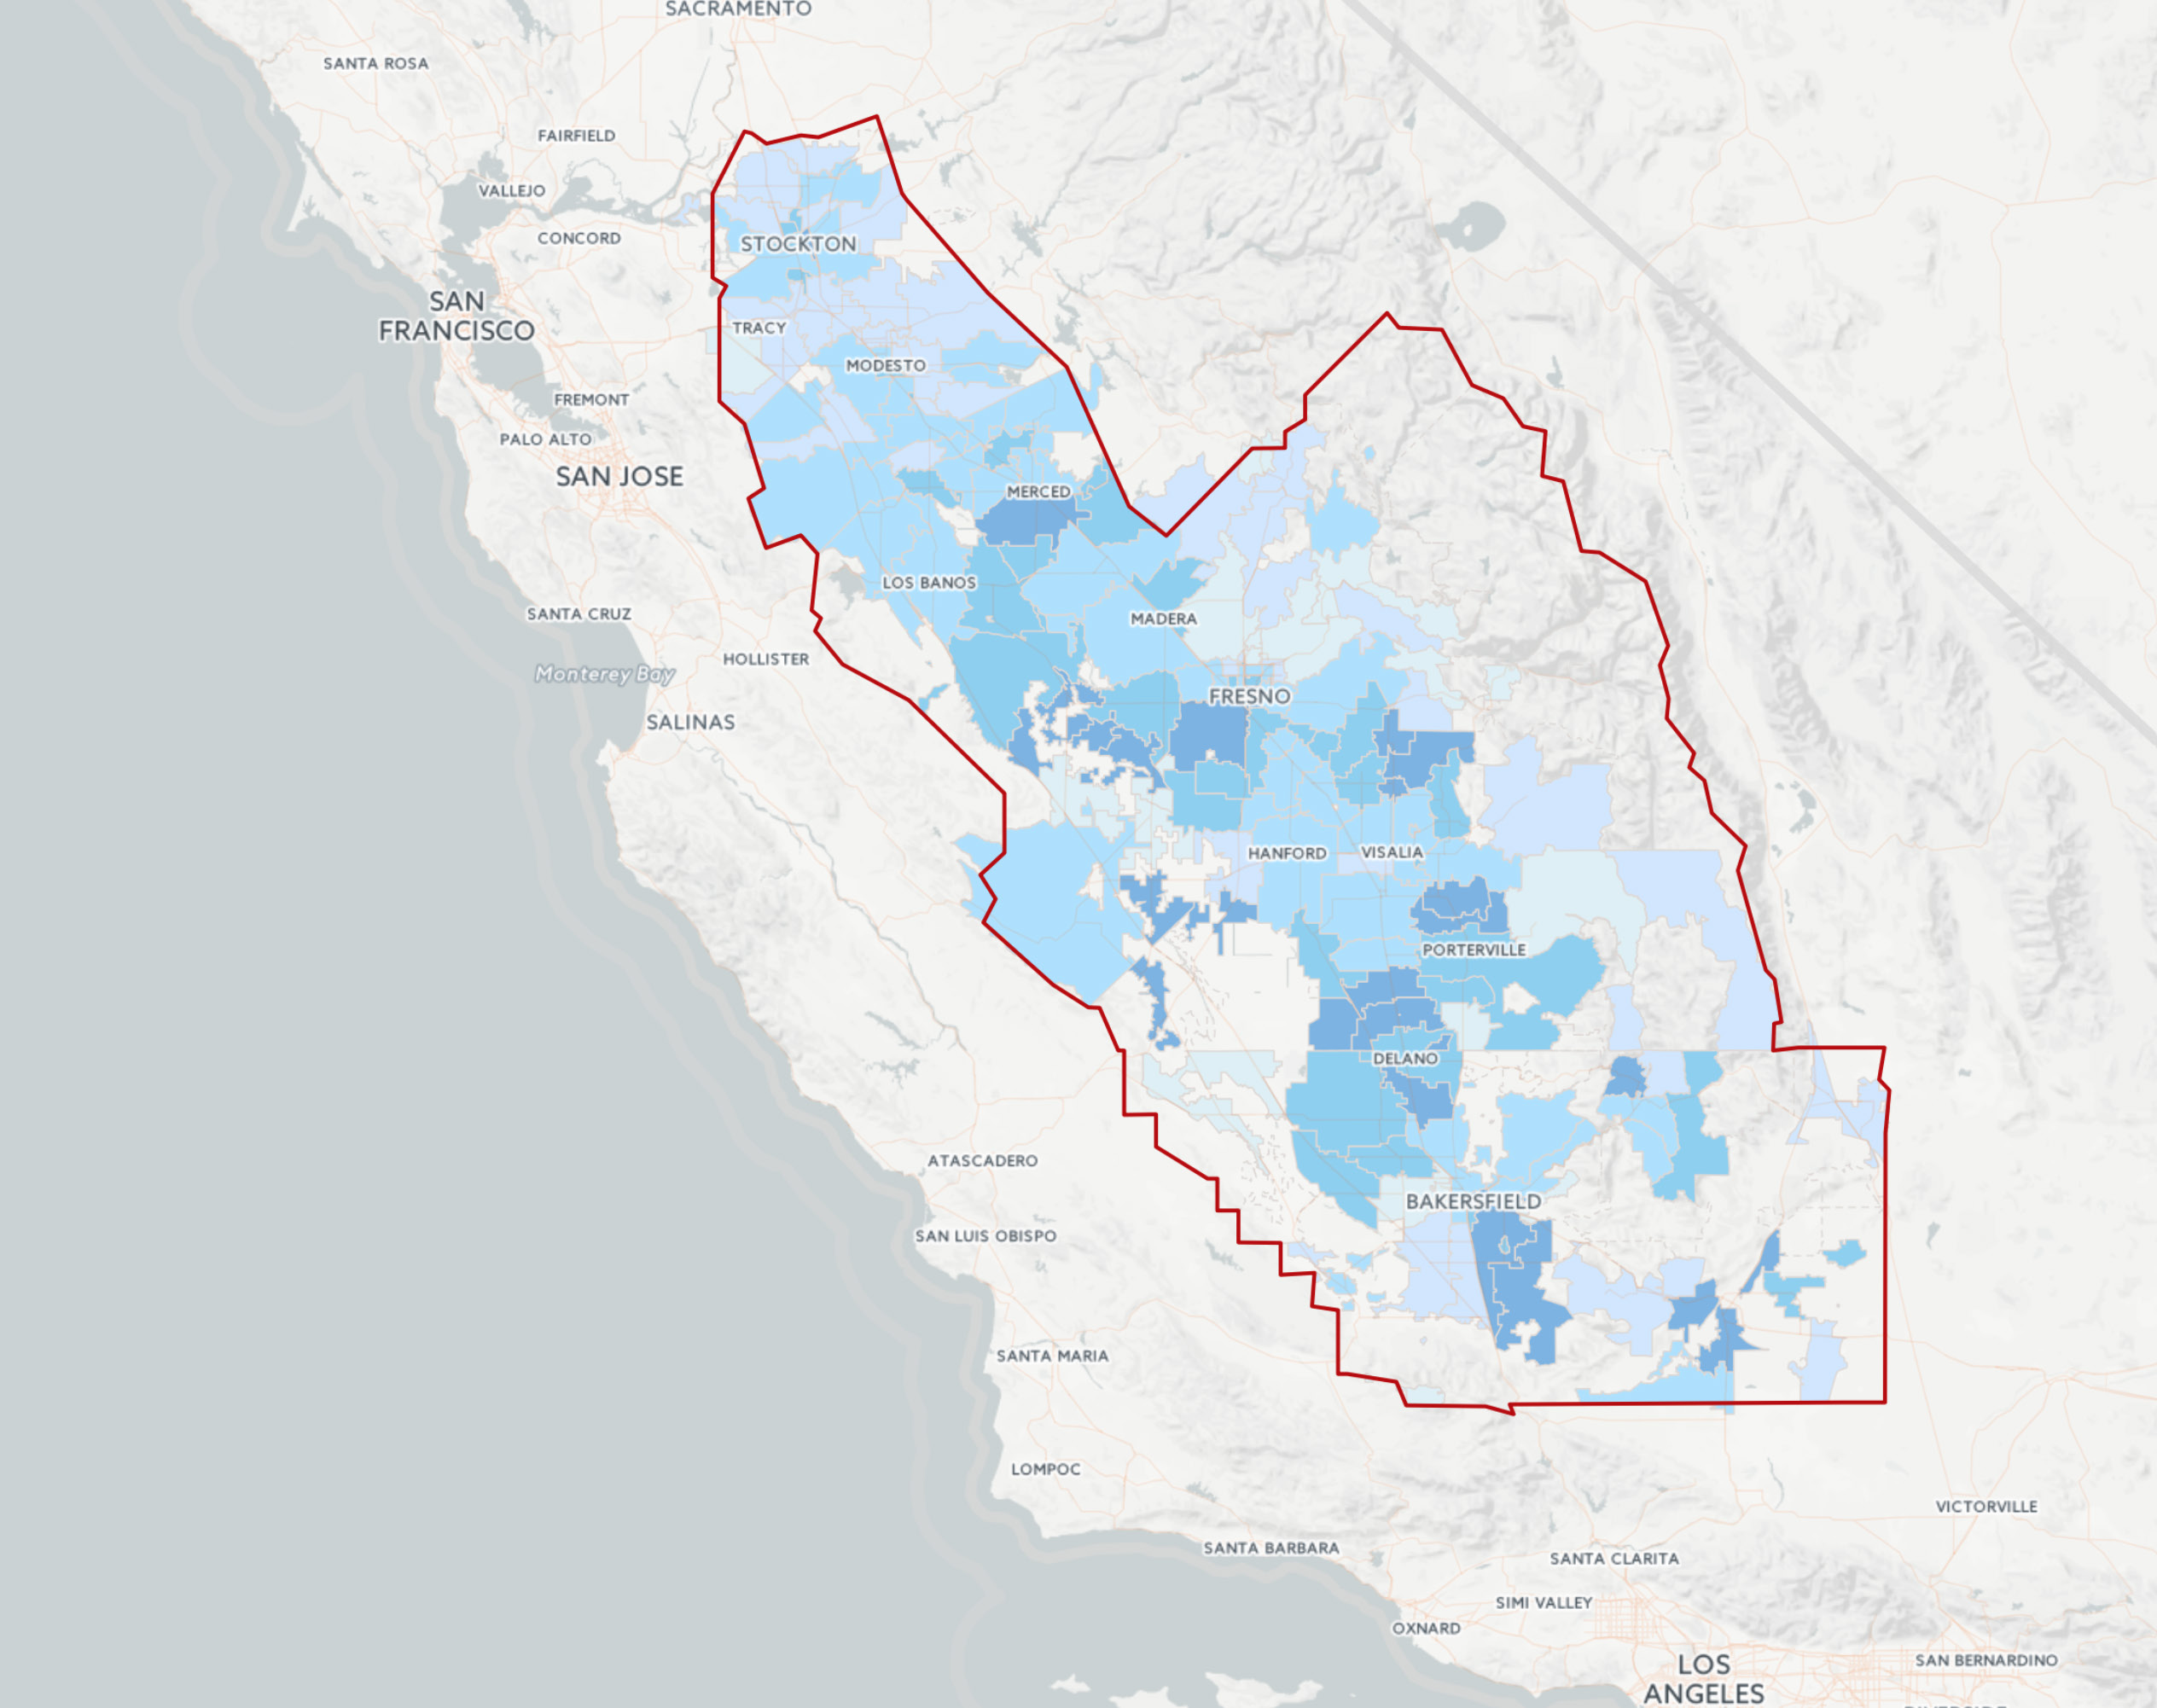

Figure D2: Walk Score by Zip Code, San Joaquin Valley, 2014

References
- http://data.worldbank.org/indicator/SP.DYN.TO65.MA.ZS
- Cutler, D., Deaton A., and LLeres-Muny, A. (2006). “The determinants of mortality’” Journal of Economic Perspectives. 20(3) 97-120.
- Bunker, J. (2001).”The role of medical care in contributing to health improvements within societies.” International Journal of Epidemiology. 30(6) 1260-1263.
- Rizutto, D. and Fratiglioni, L. (2014). “Lifestyle Factors Related to Mortality and Survival: A Mini-Review” Gerontology. 60:327–335
- Rogers R. et al. (2000). “Living and Dying in the USA: Social, Behavioral, and Biological Factors, and Sex Differences in Mortality.” Demography. 47(3): 555–578
- Montez, J. and Zajacova A. (2013). “Explaining the Widening Education Gap in Mortality among U.S. White Women.” Journal of Health and Social Behavior. 54(2) 165–181.
- Elo, I., Beltra-Sanchez, H., Mcinko, J. (2014). “The contribution of health care and other interventions to Black-White disparities in life expectancy. 1980-2007.” Population Research and Policy Review. 33(1) 97-126.
- Ahmedin, J. et al. (2008). “Widening of Socioeconomic Inequalities in U.S. Death Rates, 1993–2001.” PLoS One 3(5):e2181.
- Griffin et al. (2013) “The relationship between urban sprawl and coronary heart disease in women.” Health & Place 20: 51–61.
- Singh, G. and Siahpush, M. (2013) “Widening Rural–Urban Disparities in All-Cause Mortality and Mortality from Major Causes of Death in the USA, 1969–2009.” Journal of Urban Health: Bulletin of the New York Academy of Medicine. 91(2) 272.292.
- U.S. Department of Health and Human Services. Office of Disease Prevention and Health Promotion. Healthy People 2020. Washington, DC. https://www.healthypeople.gov/2020/topics-objectives/topic/older-adults
- Hjelmborg, J. et al (2006). “Genetic influence on human lifespan and longevity.” Human Genetics. 119:312-321.
- Brooks-Wilson A (2013). “Genetics of healthy aging and longevity.” Human Genetics. 132(12):1323-38.
- Murabito J Yuan R, and Lunetta KL. (2012)The search for longevity and healthy aging genes: insights from epidemiological studies and samples of long-lived individuals. J Gerontol A Biol Sci Med Sci. 67(5):470-9.
- Sudano J. and Baker W. (2006) “Explaining US racial/ethnic disparities in health declines and mortality in late middle age: The roles of socioeconomic status, health behaviors, and health insurance.” Social Science & Medicine 62: 909–922.
- Espinoza S. et al (2013)” The Hispanic Paradox and Predictors of Mortality in an Aging Biethnic Cohort of Mexican Americans and European Americans: The San Antonio Longitudinal Study of Aging.” J Am Geriatr Soc. 61(9): 1522–1529.
- Xu JQ et al (2104). Mortality in the United States, 2012. NCHS data brief, no 168. Hyattsville, MD: National Center for Health Statistics.
- Moss, N. (2002) “Gender equity and socioeconomic inequality: a framework for the patterning of women’s health” Social Science a Medicine. 54 649–661
- CDC’s Chronic Disease Prevention System [Internet]. Centers for Disease Control and Prevention. 2015 [cited 2015 Jul 6];Available from: http://www.cdc.gov/chronicdisease/about/prevention.htm
- Mokdad AH et al. (2004). “Actual causes of death in the United States, 2000.” JAMA. 291:1238–1245.
- Shaw A. et al (2014). “Socioeconomic inequalities in health after age 50: Are health risk behaviors to blame?” Soc Sci Med. 101: 52–60.
- de Waure C et al. (2013). ”Lifestyle interventions in patients with coronary heart disease: a systematic review.” Am J Prev Med. 45(2):207-16.
- Pahor M. et al. (2014) “Effect of structured physical activity on prevention of major mobility disability in older adults: the LIFE study randomized clinical trial.” JAMA. 311(23):2387-96.
- Einarsdóttir, K et al (2010). “Regular Primary Care Lowers Hospitalization Risk and Mortality in Seniors with Chronic Respiratory Diseases.” J Gen Intern Med. 25(8):766–73.
- Wolinksy, F. et al (2010). “Continuity of Care with a Primary Care Physician and Mortality in Older Adults.” J Gerontol A Biol Sci Med Sci. 65A(4) 421–428.
- Rosano, A et al (2012). “The relationship between avoidable hospitalization and accessibility to primary care: a systematic review.” European Journal of Public Health. 23(3) 356–360.
- van Loenen T et al (2014) “Organizational aspects of primary care related to avoidable hospitalization: a systematic review.” Family Practice 31(5):502-16.
- Bretherton, C and Parker M. (2015). “Early surgery for patients with a fracture of the hip decreases 30-day mortality.” Bone Joint J. 97-B(1):104-8.
- Shin D. et al. (2103) “Delay to curative surgery greater than 12 weeks is associated with increased mortality in patients with colorectal and breast cancer but not lung or thyroid cancer.” Ann Surg Oncol. 20(8):2468-76.
- Koul, S. et al (2104). “Delay from first medical contact to primary PCI and all-cause mortality: a nationwide study of patients with ST-elevation myocardial infarction.” J Am Heart Assoc. 3(2):e000486.
- Yabroof K. et al (2005). “Geographic disparities in cervical cancer mortality: what are the roles of risk factor prevalence, screening, and use of recommended treatment?” J Rural Health. 21(2):149-57.
- Gittelsohn A. and Powe, N. (1995). “Small area variations in health care delivery in Maryland.” Health Serv Res. 30(2):295-317.
- California Health Care Foundation (2014). All Over the Map: Elective Procedure Rates In California Vary Widely. http://www.chcf.org/ publications/2014/11/medical-variation-map.
- Karpati, A., Bassett, M and McCord. C. (2006) “Neighborhood mortality inequalities in New York City, 1989–1991 and 1999–2001” Journal of Epidemiol Community Health. 60:1060–1064
- Wright, R et al (2010) “Urban Neighborhood Context and Mortality in Late Life” J Aging Health. 22(2): 197–218.
- Greer S et al. (2014). “Metropolitan racial residential segregation and cardiovascular mortality: exploring pathways.” J Urban Health. 91(3):499-509.
- Nelson K. et al. (2011). “Neighborhood environment and health status and mortality among veterans” J Gen Intern Med. 26(8):862-7.
- Yen I. et al. (2009). “Neighborhood environment in studies of health of older adults: a systematic review.” Am J Prev Med. 37(5):455-63.
- Griffin et al (2013)
- Qian, Y. et al. (2013). “Epidemiological evidence on association between ambient air pollution and stroke mortality.” J Epidemiol Community 67(
- Shumake K. et al. (2013). “Susceptibility of older adults to health effects induced by ambient air pollutants regulated by the European Union and the United States” J. Aging Clin Exp Res. 25(1):3-8.
- Krewski D et al. (2009). “Extended follow-up and spatial analysis of the American Cancer Society study linking particulate air pollution and mortality. Res Rep Health Eff Inst. (140):5-114;